
Van den Broek, J.1, Damveld J.H.1, Cheng, C.H.2, Soetaert, K.2, Borsje, B.W.1, Hulscher, S.J.M.H.1
1 University of Twente, This email address is being protected from spambots. You need JavaScript enabled to view it., 2 NIOZ and Utrecht University
Large parts of the sandy seabed of shallow seas are covered with rhythmic bed patterns. These bed patterns result from the complex interaction among hydrodynamics, seabed topography and sediment transport. The most dynamic bed patterns are tidal sand waves which generate in several years’ time, may grow up to 25% of the water depth, have wavelengths of hundreds of meters and migrate at a speed of several meters per year. Moreover, sand waves are inhabited by benthic macrofauna which are invertebrate animals that are > 0.5 mm in size. Broadly speaking, most of them can be divided into two major feeding groups. The deposit feeders ingest large volumes of sediment to consume the organic material and microbes. Suspension feeders, on the other hand, filter organic matter from the overlying water column.
Collectively, these feeding processes can have significant consequences on the sediment dynamics. Insight in the transport of organic matter in sand wave areas is scare, and is important to understand to link the biological and physical processes (and vice versa). Therefore, the aim of this study is to understand the transport of organic matter in a sand wave field. To this end, we combine (i) a numerical sand wave model (van Gerwen et al, 2018) and (ii) a biogeochemical model (Soetaert et al, 2016).
Results show that reversing flow currents during slack tide are causing the organic matter to be transported over distances greater than one sand wave. Conversely, during flood and ebb flow the organic matter accumulates on the lower slopes and in the troughs of the sand waves. A recent field campaign, as part of the SANDBOX program, collected both physical and biological data in a sand wave field near Texel. These field data agree generally well with the results of this modelling study.
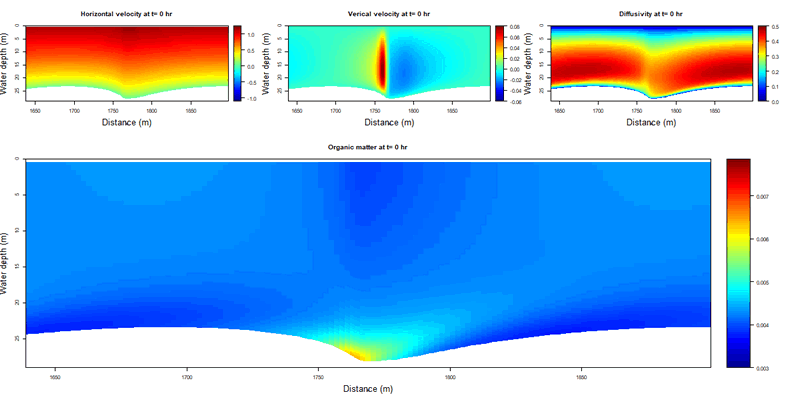
Figure 1 Flood values for (a) horizontal velocity, (b) vertical velocity, (c) vertical diffusivity and (d) organic matter concentration.
Acknowledgement
The authors greatly acknowledge NWO, Boskalis and NIOZ for their financial support of the SANDBOX program.
References
van Gerwen, W., Borsje, B. W., Damveld, J. H., & Hulscher, S. J. M. H. (2018). Modelling the effect of suspended load transport and tidal asymmetry on the equilibrium tidal sand wave height. Coastal Engineering, 136, 56–64. DOI 10.1016/j.coastaleng.2018.01.006
Soetaert, K., Mohn, C., Rengstorf, A., Grehan, A., & Van Oevelen, D. (2016). Ecosystem engineering creates a direct nutritional link between 600-m deep cold-water coral mounds and surface productivity. Scientific Reports, 6, 1–9. DOI 10.1038/srep35057