S.D. Kamminga1, H.C.Peters2
1 Nortek B.V., This email address is being protected from spambots. You need JavaScript enabled to view it.
2 Rijkswaterstaat, This email address is being protected from spambots. You need JavaScript enabled to view it.
Introduction
In the cold winter of 2017/2018 considerable amounts of ice were formed in the Dutch part of the Wadden Sea and in the tidal inlets, connecting the relatively shallow Wadden Sea with the adjacent deeper North Sea, where no ice was formed. The aerial photograph shows the formation of sea ice near the Island of Ameland., Fig 2.. Given the possible threats of such large ice formation to e.g. shipping and recreation the authorities would like to have a real-time surveillance technique that continuously (24/7) outlines the extent and movement of the ice sheets.
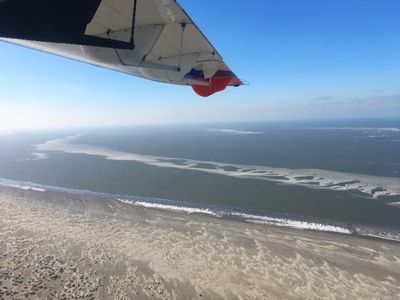
Fig 1: Aerial image with the beach in front and a patch of ice in the back.
Methods
In order to continuously observe the extent and flow of ice the X-band radar on the lighthouse of Ameland was selected. The processing computer that acquires radar data stores raw images every 1.5 seconds. These raw images are then averaged over a time window of approximately 1 minute, containing 42 images. This averaging process effectively removes all rapidly changing features e.g. due to surface waves. Consequently, only the semi-permanent and persistent sea surface structures remain like e.g. bottom induced features and ice. The ice is visible in the VV polarized radar images as deep black areas indicating that their radar backscatter properties are low. This is illustrated in the averaged radar image, Fig. 2. One of the ice patches is indicated with the red arrow.
By combining the average images into a series (in the order of several hours) a video has been made that clearly shows the flow of ice in the Ameland Tidal Inlet, around the western part of Ameland.

Fig 2: Averaged radar image of the Ameland inlet. One of the ice patches is indicated with a red arrow.
Results
Results in the form of a time-lapse video and still images will be presented. These results will be compared with aerial photographs. It will be shown that these images are able to effectively monitor the extent and flow of ice.