
J. M. Krabbendam1,2*, A. Nnafie1,2, L. M. Perk2, B. W. Borsje3, H. E. De Swart1
1 Utrecht University, This email address is being protected from spambots. You need JavaScript enabled to view it., This email address is being protected from spambots. You need JavaScript enabled to view it., This email address is being protected from spambots. You need JavaScript enabled to view it.
2 WaterProof B.V., This email address is being protected from spambots. You need JavaScript enabled to view it., This email address is being protected from spambots. You need JavaScript enabled to view it.
3 University of Twente, This email address is being protected from spambots. You need JavaScript enabled to view it.
Introduction
Tidal sand waves are rhythmic bed forms located in many coastal seas. These bed forms have heights up to ten meters and migration rates of several meters per year. Due to their dynamic nature, sand waves can uncover buried cables and pipelines, thereby making them subject to risk of damage. This study aims at developing a new numerical 2DV model (Delft3D) to simulate the past evolution of tidal sand waves on a decadal timescale (hindcast study). In particular, the effect of imposing different types of boundary conditions (time series of currents, water levels and Riemann invariants) on sand wave evolution is investigated. Simulations are conducted for a period of ten years, whereby an observed sand wave field is used as an initial bathymetry. Model results show that imposing time series of Riemann invariants at one boundary and of water level at the other yields the best agreement with bed level observations.
Methods
The study area consists of a 45.5 km transect located between two measuring buoys in the North Sea which were deployed by offshore survey service Fugro in future wind parks Hollandse Kust Zuid (HKZ) and Hollandse Kust Noord (HKN). In this area, bathymetrical surveys were performed by the Netherlands Hydrographic Office of the Royal Netherlands Navy both in 2000 and 2010. For a certain transect, the bed level observed in 2000 is used as model input and the model output is compared with the measured bed level in 2010. The tidal flow is forced with velocity and water level timeseries measured by the two buoys. These timeseries were imposed in four different ways: (1) Riemann invariants at both open boundaries (RR); (2) depth averaged velocity at one and water level timeseries at the other boundary (Uζ); (3) a water level time series at both boundaries (ζζ) and (4) a Riemann invariant at one and water levels at the other boundary (Rζ). Other model settings are a horizontal grid spacing of 10 m, 50 vertical sigma layers of decreasing thickness towards the bed, a hydrodynamic time step of 6 s and a morphological run time of 10 years with a morphological acceleration factor of 100.
Results
Figure 1 shows the observed bed level of 2000 (black dotted line) and 2010 (black solid line). The different colors correspond to modelled bed levels resulting from forcing with different boundary conditions. The red line corresponds to the best model result, i.e. this modelled bed level is closest to the observed bed level of 2010 in terms of sand wave length, height, shape and migration and corresponds to tidal flow forced with one Riemann invariant and one water level time series.
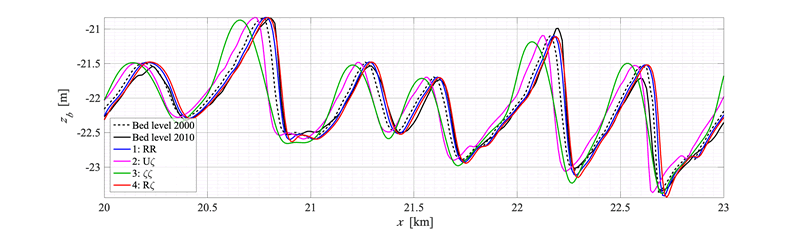
Figure 1. Bed level zb measured in 2000 and 2010 (dashed and solid black lines, respectively) over x, and simulated zb for the different types of boundary conditions: 1. two Riemann invariants (RR, blue); 2. depth-averaged velocity and water level time series (Uζ, magenta); 3. two water level time series (ζζ, green); 4. Riemann invariants (Rζ, red).