
G. Strypsteen1, Bart Roest1 and P. Rauwoens1
1 KU Leuven, Department of Civil Engineering, Technology Cluster Construction, Bruges, Belgium This email address is being protected from spambots. You need JavaScript enabled to view it., This email address is being protected from spambots. You need JavaScript enabled to view it.
Sediment input by wind to the adjacent coastal dune system at the decadal timescale is usually predicted by incorporating hourly wind speed and direction data measured at standard meteorological stations into sediment transport equations. Variations in aeolian sediment input to the dunes, along the Belgian coast, were calculated based on a modified Bagnold model using representative values for mean grain size and coastal orientation. The modified Bagnold model is validated by aeolian field campaigns carried out since 2016. These potential sediment calculations were related to dune volume changes for the period 2000-2017. Since the 1970’s, LiDAR surveys are performed along the 65 km Belgian coast to monitor beach, foreshore and dune. Depending on the amount of aeolian sediment input and dune erosion, dune volume changes over time. Worldwide, dune volume is an important factor for coastal safety which provide protection for the hinterland against storms. Dune volume changes along the Belgian coast are generally between -50 and +50 m³/m (Figure 1). Between each survey there is considerably longshore variability in dune volume change. Furthermore, large differences in dune volume change are found between each year. Dune volume change along the Belgian coast mainly show a positive linear trend in time (dune growth). It is found that half of the coastal sections with dune growth have correlation coefficients larger than 0.9. This indicates that a large part of the dune volume data is well represented using a linear model in time. For the period 2000-2017, the wind regime consists of a fairly balanced mix of moderate (85% of winds are below 8 m/s) onshore, offshore and shore-parallel winds. Wind speeds between 8-10 m/s take the largest portion of the total sediment transport. The mean direction of potential transport over all years is 260 ± 14° to the North (southwest), indicating that the direction is fairly constant. For some years potential transport is up to 3 times larger than other years. Aeolian sediment input to the dunes varied between 0 and 16 m³/m. However, no significant relation is found between dune behaviour and potential sediment transport on yearly to decadal timescale. Due to transport limiting factors, wind forcing alone is not sufficient to explain the year-to-year variability in dune growth rates at the Belgian coast.
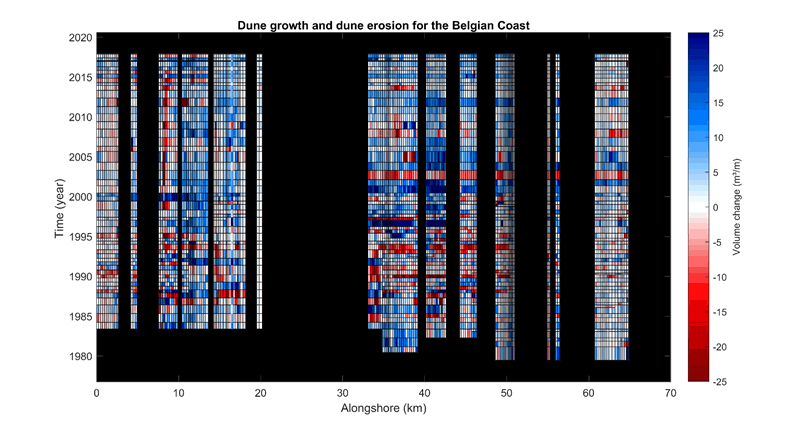
Figure 1 Dune growth and dune erosion along the Belgian coast since the start of the LiDAR measurements. The columns represent the coastal sections with presence of vegetated dunes.