V.M. van Bergeijk1*, J. J. Warmink1, S.J.M.H. Hulscher1
1 University of Twente,
Introduction
Wave overtopping on grass-covered dikes results in high hydraulic loads on the dike cover which may lead to erosion of the dike cover. Transitions in cover type and in geometry are vulnerable locations for dike cover erosion. Changes in bed roughness can create additional turbulence and geometric transitions can lead to impact of the waves. The effect of transitions on the forces of the overtopping wave are unknown, since these forces are hard to measure during this highly turbulent flow and measurement equipment damages the grass cover and thereby affects the flow. We developed a hydrodynamic model to calculate the forces of the overtopping waves and investigate the effects of transitions on these forces.
Methods
A 2DV model for the overtopping flow over the crest and landward slope is developed in the open-source software OpenFOAM (Van Bergeijk et al., 2020). The model requires the flow velocity and layer thickness as boundary conditions, which can be generated from the overtopping volume. The model output includes the flow velocity, pressure, shear stress and normal stress as function of time, cross-dike location and height. The dike geometry is varied to simulate various geometric transitions and the roughness height in the turbulence model is adapted to simulate changes in cover type.
Results
The model results show that changes in roughness have no significant effect on the pressure, shear and normal stress. The flow velocity increases from a rough to a smooth cover which is well presented by the friction coefficient in analytical models (Van Bergeijk et al., 2019). Geometric transitions, such as the transition from the crest to the landward slope and the toe, lead to a high peak in the modelled pressure. The dike geometry has a large affect on the overtopping forces, where both the maximum shear stress and maximum pressure along the slope increase with increasing slope steepness (Figure). Additional model simulations are currently performed in order to study why the pressure increases at geometric transitions and to study other geometric transitions such as erosion holes or vertical cliffs.
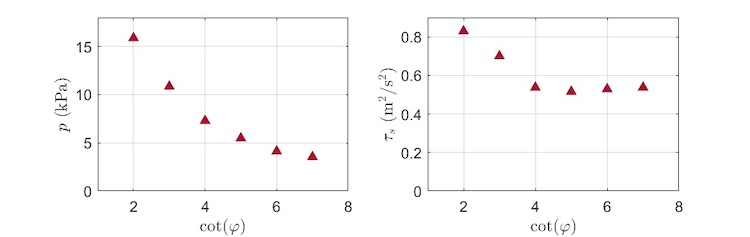
Figure: The maximum pressure p and the maximum shear stress τs as function of the slope steepness cot(φ) for an overtopping volume of 4000 l/m.
Acknowledgements
This research was funded by the Netherlands Organisation for Scientific Research (NWO), research programme All-Risk with project number P15-21.
References
Van Bergeijk, V.M., Warmink, J.J. & Hulscher, S.J.M.H. (2020). Modelling the Wave Overtopping Flow over the Crest and the Landward Slope of Grass-Covered Flood Defences. Journal of Marine Science and Engineering. 8, 489
Van Bergeijk, V. M., Warmink, J. J., van Gent, M. R. A., & Hulscher, S. J. M. H. (2019). An analytical model of wave overtopping flow velocities on dike crests and landward slopes. Coastal Engineering, 149, 28-38
I. Surname1*, F.N. Another-Surname2 , Y. Next-Surname2
1 University Name, Country; 2 Organization Name, Country
* Corresponding author: mail.name@organization.org
