S.M. Beselly1,2,5*, M. van der Wegen1,3, U. Grueters4, J. Reyns1,3, J. Dijkstra3, D. Roelvink1,2,3
1 IHE Delft Institute for Water Education
2 Delft University of Technology
3 Deltares
4 Institute of Plant Ecology, Justus-Liebig-University of Giessen, Germany
5 Water Resources Engineering Department, Universitas Brawijaya, Indonesia.
Introduction
The Porong Delta in Indonesia has been experiencing a rapidly prograding delta along with mangrove expansion in 15 years. It was triggered by an extreme mud volcanic eruption called LUSI. This eruption was at a peak rate of up to 180,000 m3/day in 2006 and declined to 50,000m3 in September 2011. LUSI is still actively erupting at a considerably reduced rate. The diversion operation has been conducted since 2009 by storing and conveying the mudflow to the Porong River. This operation has increased sediment concentration and loads of the Porong River by a factor of three to four compared to pre-LUSI conditions. As a result, we observed the build-up of the delta lobes and the mangrove expansion. The Porong area has a tropical monsoon climate characterised by the wet and dry season. We observed the seasonal river discharge fluctuation that correlates with the seasonal pattern of mangrove expansion. The objective of this study is to analyse the seasonal mangrove dynamics in the cloud computing Google Earth Engine (GEE) by creating three-monthly mangrove and age class maps.
Methods
The random forest supervised classification in GEE was used to classify the mangroves. Our maps are more frequent than commonly produced annual mangrove maps. Based on these validated time series of mangrove extent maps, we further estimated the age of the forest and developed the age class map. The age class map was referenced to November 2019 and derived backward to 2009. Additionally, by taking advantage of the high-resolution Canopy Height Model (CHM) from previous study and this age map, a relationship of mangrove height dependent on stand age was setup.
Results
Our analysis shows a unique and high spatiotemporal resolution of mangrove extent maps. We observe a recession of the mangrove extent during the transition of dry to wet season and regrowth during the wet and dry season. Generally, the net development trend of the mangrove area is positive. We can see that the high-low signal amplitude differs in the period of 2013-2017 from that in 2018-2019. It is likely in the beginning, mangroves start growing on the newly deposited mud. Due to the presence of mangroves, sediment is deposited at the margin of the forest, thus creating the basin mangrove type in a certain area. Since the young mangroves are more sensitive to salt and drought, they might die under that condition. Therefore, we observe the seasonal pattern of recession and expansion of the mangrove forest.
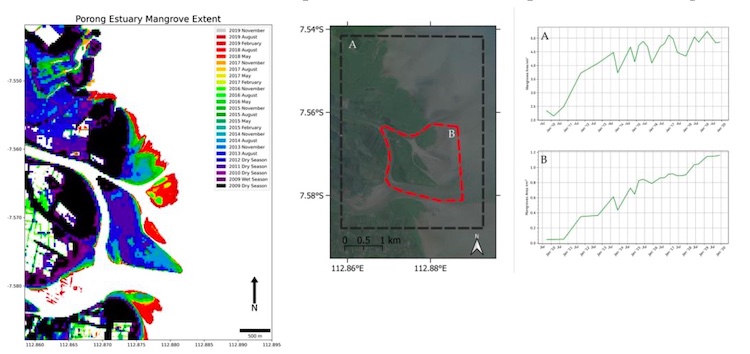
Figure: Porong Estuary mangrove extent from 2009-2019 (left figure) and time series of mangrove extent area development (right figure).
I. Surname1*, F.N. Another-Surname2 , Y. Next-Surname2
1 University Name, Country; 2 Organization Name, Country
* Corresponding author: mail.name@organization.org
