S.G. Pearson1,2*, B.C. van Prooijen1, E. Elias2, Z.B. Wang1,2
1 Delft University of Technology,
2 Deltares,
Introduction
Sediment connectivity is a framework for describing networks of sediment transport pathways in coastal environments. It provides a systematic means of quantifying complex systems, taking advantage of conceptual developments in graph theory and analysis tools developed in other fields (e.g. neurology, ecology, hillslope geomorphology). Applying this approach to coastal systems using model results and measurements lets us to identify key pathways and connections at multiple space and time scales.
Methods
We used a tide-only Delft3D sediment transport model as a basis for determining the connectivity of Ameland ebb-tidal delta in the Netherlands. First, we defined geomorphic cells within the system based on bathymetry and functional characteristics. The sediment flux between these units was tabulated into an adjacency matrix (Figure 1a), representing sediment travelling from a particular source to a given receptor. This matrix can then be represented as a network diagram (Figure 1b) where the system has been schematized as a series of nodes (geomorphic cells) and the links (fluxes) between them. Once schematized this way, we can measure the connectivity and emergent patterns of the network using statistical metrics including network density, modularity, and centrality.
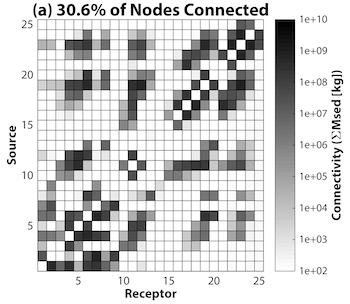
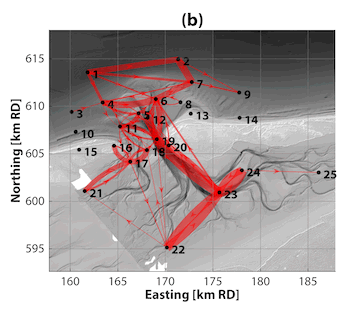
Figure 1 Connectivity of the Ameland Inlet system, based on tide-only Delft3D numerical simulations. (a) An adjacency matrix can be derived from model output and quantifies the fluxes of sediment between geomorphic cells in a coastal system. Asymmetry in this matrix indicates net sediment transport, and self-self interactions (main diagonal) are not considered. (b) A network diagram visualizes sediment connectivity of Ameland ebb-tidal delta. The centre of each geomorphic cell is indicated as a numbered node, and the top 5% strongest sediment pathways between them are indicated by red lines. Line thickness qualitatively indicates the magnitude of sediment transport between two nodes, and arrows indicate direction.
Results
Ameland Inlet is most strongly connected between its major channels and ebb tidal delta. Connectivity is greater for finer than coarser sediment, and there is a tendency towards increased connectivity at longer time scales. With this approach we can quantify sediment bypassing pathways around the inlet and classify the domain into distinct sediment-sharing modules. Connectivity is a valuable tool for analysing sediment pathways in coastal environments, and the wealth of existing tools for its analysis make it accessible for researchers and practitioners alike.
I. Surname1*, F.N. Another-Surname2 , Y. Next-Surname2
1 University Name, Country; 2 Organization Name, Country
* Corresponding author: mail.name@organization.org
