A.Ionescu 1, M.A.de Schipper1*, J. Storms1
1 TUDelft,
Sediment characteristics are key controls on sediment pickup, settling and advection. However, the majority of coastal beach evolution forecasts are made by assuming homogeneity in sediment type in a coastal cell. Yet, this bed composition may vary in both space and time and these spatiotemporal patterns are poorly known and understood. In this study, we examine the characteristics of the bed level sediments along the 17 km Delfland coast from sediment sampling data. The study area stretches from Hoek van Holland to the Scheveningen harbour, with the Sand Engine in its centre.
Methods
In total 96 samples were collected from the beach along two different elevations; in the intertidal zone at 0.2 m above NAP (NAP ≈ mean sea level) and on the supratidal beach at 1.7 m above NAP. These samples were analysed to obtain the grain size distributions. From these distributions, the D50 values and fraction of shells (taken as the weight percentage of the fraction larger than 2 mm) were mapped and compared with several hypotheses on grain size controls.
Results
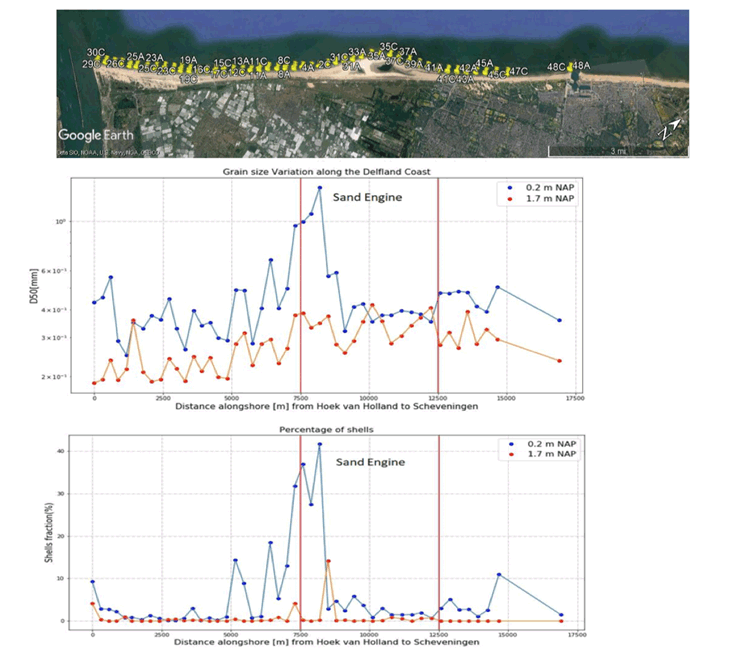
Observations show a median particle diameter D50 of 0.465 mm ( = 0.221 mm) at the 0.2 m elevation when averaged for the entire. Higher up the beach the grain size is finer, with 0.281 mm ( = 0.067 mm) on average at the 1.7 m NAP level. Grain size increases slightly from south to north with particularly large grain size and shell fractions near (southern end of the) Sand Engine. These values do not show any correlation with the local beach slope or sedimentary/erosional trends of the profile.

Figure 1 Spatial patterns in bed material along the Delfland coast. (Top) Sampling locations, (middle) median grain size at different levels, (bottom) shell fraction percentage. Source top panel: Google Earth.
I. Surname1*, F.N. Another-Surname2 , Y. Next-Surname2
1 University Name, Country; 2 Organization Name, Country
* Corresponding author: mail.name@organization.org


