
M. Krabbendam*1, A. Nnafie1, L. M. Perk2, B. W. Borsje3, H. E. de Swart1
1 Institute for Marine and Atmospheric Research, Utrecht University,
2 WaterProof B.V.
3 Faculty of Engineering Technology, University of Twente,
Introduction
Tidal sand waves are dynamic, rhythmic bedforms found all over the North Sea, which may interfere with offshore human activities, such as the construction and maintenance of cables and pipelines. For these activities, detailed information about the morphodynamic evolution of sand waves is necessary, but often lacking, due to coarse resolution of data. The use of 3D sand wave models could bridge this knowledge gap, but these models are computationally expensive. Therefore, the question arises whether less costly 2DV models are good alternatives and the objective of this study is to evaluate the performance of a 2DV model in hindcasting the evolution of observed tidal sand wave fields.
Methods
In this study, a 2DV Delft3D sand wave model based on the model Van Gerwen et al. (2018) is applied to three locations in the North Sea. At these locations, data of the Dutch Hydrographic Office of the Royal Dutch Navy are used to construct initial bathymetry profiles along the transects which are oriented perpendicular to sand wave crests. The model is forced with a combination of water levels and velocities, which are provided by the continental shelf model DCSM-Zuno v6 (Zijl et al., 2015). Van Rijn (1993) formulations are used to compute the bed load and suspended load transports.
Results & discussion
At all three locations, modelled transects are quite different from observed sand wave transects, even after model calibration (Fig. 1), indicating that 2DV models might not be sufficient for quantitative sand wave predictions on a decadal time scale. We are now comparing sand transports computed with a full 3D model with sand transports from the 2DV model to determine to what extent including this second horizontal dimension improves the accuracy of sand wave predictions.
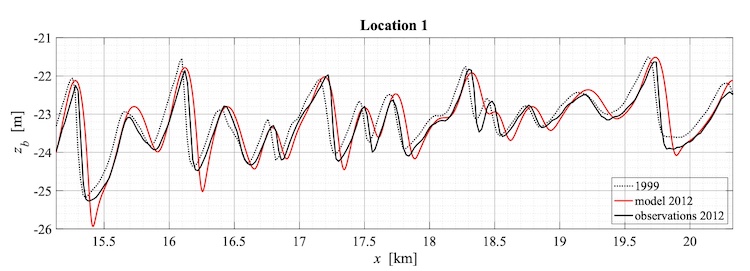
Figure 1: initial bed level profile from 1999 (black dotted line), observed bed level profile in 2012 (black solid line), modelled bed for 2012 (red line).
References
Van Gerwen, W., Borsje, B. W., Damveld, J. H., and Hulscher, S. J. (2018). Modelling the effect of suspended load transport and tidal asymmetry on the equilibrium tidal sand wave height. Coastal Engineering, 136:56–64.
Van Rijn, L, C. (1993). Principles of sediment transport in rivers, estuaries and coastal seas. Aqua Publishers, the Netherlands.
Zijl, F., Sumihar, J., & Verlaan, M. (2015). Application of data assimilation for improved operational water level forecasting on the northwest European shelf and North Sea. Ocean Dynamics, 65(12), 1699-1716.
I. Surname1*, F.N. Another-Surname2 , Y. Next-Surname2
1 University Name, Country; 2 Organization Name, Country
* Corresponding author: mail.name@organization.org
