L. Portos-Amill1*, P.C. Roos1, J.H. Damveld1, S.J.M.H. Hulscher1
1 Water Engineering and Management, University of Twente, The Netherlands
* Corresponding author: l.portosamill@utwente.nl
Introduction
Tidal sand waves are abundantly present in tide-dominated sandy shelf seas, such as the Dutch North Sea. They exhibit different characteristics (wavelengths of 100-1000 m, heights of 1-10 m, and migration rates of 1-10 m/yr; van Dijk & Kleinhans,2005). Yet, bedform information is generally not considered in basin-scale hydrodynamic models, such as the Dutch Continental Shelf Model (DCSM) of the North Sea. The grid sizes of such models are too coarse to resolve individual sand waves. However, the presence of sand waves may be implicitly included in the roughness coefficient (i.e., form roughness), which would introduce a more realistic and physics-based element into these kind of models. Instead, the bed roughness of these models is obtained from calibration against observations of tidal sea surface elevation (Zijl et al., 2023), leading to large differences in bed roughness in space, which lack a physical explanation.
Form roughness parametrizations have been widely studied in river settings for river dunes and ripples (Lefebvre & Winter, 2016; van Rijn, 1993). However, the tide, unlike a unidirectional flow, is characterised by several constituents, each expressed in terms of an amplitude and a phase. Thus, the study of form roughness in a tidal setting demands a more refined analysis than in a fluvial (unidirectional) setting.
Objective and Methods
The aim of the present research is (1) to extend the concept of form roughness to a tidal setting and (2) to assess how sand wave-induced form roughness depends on bedform characteristics (wavelength, height, asymmetry). To this end, we use two hydrodynamic models: a second order perturbation approach (PA) and Delft3D.
The overall principle behind the methodology used for both models is identical. We compare a model run that explicitly includes sand waves, with one with a flat bed and an increased roughness. The increase in roughness needed for both runs to be equivalent is thus the form roughness.
We force our simulations with an M2 tide and compute the increase in roughness needed such that the M2 phase or amplitude of the depth-averaged flow are the same for the sand wave situation and the flat bed situation with an increased roughness. Importantly, this leads to two sand wave-induced form roughness values for the PA: amplitude-based and phase-based for the depth-averaged flow. Additionally, Delft3D allows for the study of the sea surface elevation. Thus, with Delft3D we can compute sand wave-induced roughness values based on four different equivalence criteria: amplitude-based or phase-based for both the depth-averaged flow and the sea surface elevation.
Results
Results show that the presence of sand waves causes a phase shift of the depth-averaged flow and sea surface elevation signals, as well as an amplitude decrease. These variations of the flow and sea surface elevation can be reproduced by a flat bed simulation with an increased roughness, but not all at once. Thus, it is not possible to reproduce the depth-averaged flow (or sea surface elevation) signal as a whole with an increased roughness, but only its M2 phase or amplitude. This demonstrates the added complexity of a tidal setting with respect to a fluvial setting.
Furthermore, we studied the dependence of sand wave-induced form roughness on sand wave characteristics by running sand wave simulations with different height, wavelength or asymmetry (latter not shown), and keeping the default values for the other characteristics (symmetric sand wave of 4 m in height and 350 m in wavelength). Both models yield the same qualitative results: higher and shorter sand waves produce a higher value for the form roughness. Yet, results obtained with the PA are one order of magnitude lower than with Delft3D, meaning that it is the more complex processes included only in Delft3D that result in the main source of roughness.
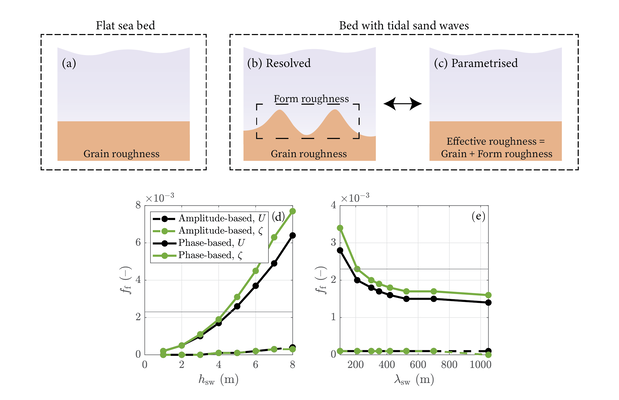
Top: schematic representation of sand wave-induced form roughness: (a) the roughness that the flow experiences over a flat bed is purely due to grain roughness. Sand waves add additional roughness to the seabed, which can be modelled either by (b) resolving the sand waves or (c) imposing an increased effective roughness over a flat bed. Bottom: Form roughness obtained from Delft3D simulations (ff) in terms of (d) sand wave height and (e) wavelength. Thin black line corresponds to the grain roughness.
References
Lefebvre, A., & Winter, C. (2016). Predicting bed form roughness: the influence of lee side angle. Geo-Marine Letters, 36, 121-133.
Van Dijk, T. A., & Kleinhans, M. G. (2005). Processes controlling the dynamics of compound sand waves in the North Sea, Netherlands. Journal of Geophysical Research: Earth Surface, 110(F4).
Van Rijn, L. C. (2008). Effective bed roughness. In Principles of sediment transport in rivers, estuaries, coastal seas and oceans. Amsterdam, The Netherlands: Aqua Publications.
Zijl, F., Zijlker, T., Laan, S., & Groenenboom, J. (2023). 3D DCSM FM: a sixth-generation model for the NW European Shelf. Technical report, Deltares 2023.
