C.H. Bedon Pineda1*, L. Portos-Amill1, P.C. Roos1
1 Water Engineering and Management, University of Twente, The Netherlands
* Corresponding author: c.h.bedonpineda@student.utwente.nl
Introduction
Coastal environments exhibit various bedforms, with sand waves being of particular interest due to their influence on flow, sediment transport, and morphology (van der Meijden et al., 2023). While numerous models simulate tidal flow, none explicitly includes form roughness induced by these sand wave fields. For instance, the roughness coefficient in the Dutch Continental Shelf Model (DCSM) is calibrated solely to match observed water levels. Portos-Amill et al.'s (submitted) process-based modelling approach addresses this gap by quantifying form roughness induced by sand waves, based on water depth, tidal flow amplitude, grain size, and sand wave characteristics. This provides four criteria to compute form roughness value; either amplitude-based or phase-based, to match the M2 depth-averaged flow or sea surface elevation. The resulting roughness may vary depending on the criterion chosen, highlighting the complex interactions between sand waves and tidal currents.
Objective and Methods
The objective of this research is to calculate the values of the effective roughness coefficient for a section of the Netherlands Continental Shelf that represents the depth-averaged flow or sea surface elevation in the presence of sand waves. To this end, data on M2 tidal amplitudes, mean water depth, mean grain size, and sand wave dimensions were retrieved from Damen et al. (2018) and refined for smoother visualization. Six study areas of 22.2x44.4 km2 were selected based on similar sand wave characteristics and the mean values of each parameter were calculated. Only one out of the six was further studied due to time limitations. Next, the 2DV Delft3D model by Portos-Amill et al. (submitted) was used to calculate the form roughness value. The model initially resolves the hydrodynamics over a sand wave field and then iterative runs are carried out with increased effective roughness over a flat bed to identify the roughness coefficient that is most representative to match the amplitude or phase of the M2 depth-averaged flow or sea surface elevation for the situation that includes the sand waves. Thus, the difference between the increased effective roughness and the grain-induced roughness provides the form roughness.
Results
The chosen study area (52.1° to 52.3° latitude and 3° to 3.4° longitude) corresponds to the zone with the highest Manning coefficients (0.037 s/m1/3) surrounded by relatively low values in the DCSM (Figure 1a). The effective roughness coefficient values to better represent the amplitude of the M2 depth-averaged flow and sea surface elevation is 0.029 s/m1/3. Contrarily, the phase-based criteria yield a value of 0.036 s/m1/3 for both the flow and sea surface elevation. Notably, neither matches the current value used in the DCSM, although the phase-based coefficient is relatively similar. This difference, however, leads to a different pattern in the M2 depth-averaged flow (Figure 1b) and the sea surface elevation. Moreover, the amplitude-based roughness coefficients, are more similar to the neighbouring roughness coefficients in the DCSM. These results demonstrate the inherent complexity of simulating tidal flow over a sand wave field. Highlighting the importance of deciding on the specific criterion (either amplitude-based or phase-based, to match the M2 depth-averaged flow or sea surface elevation) that will guide the calibration of tide-influenced models.
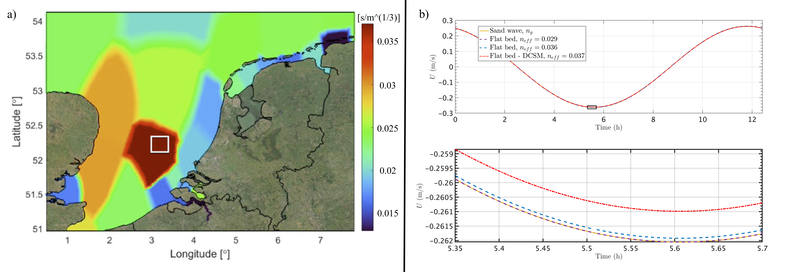
Figure 1. (a) Roughness values used in the DCSM (retrieved from Zijl et al., (2022)). The white box indicates the study area. (b) Depth-averaged flow for sand wave simulation compared to flatbed simulation with the form roughness coefficients obtained for the amplitude and phase-based criteria, and the coefficient currently used in the DCSM: (Top) Complete M2 tidal period. (Bottom) The zoomed-in region as showed in the top plot.
References
Damen, J. M., van Dijk, T. A. G. P., & Hulscher, S. J. M. H. (2018). Spatially Varying Environmental Properties Controlling Observed Sand Wave Morphology. Journal of Geophysical Research: Earth Surface, 123(2), 262–280. https://doi.org/10.1002/2017JF004322
Portos-Amill, L., Roos, P. C., Damveld, J. H., & Hulscher, S. J. M. H. (submitted). Modelling form roughness induced by tidal sand waves.
van der Meijden, R., Damveld, J. H., Ecclestone, D. W., van der Werf, J. J., & Roos, P. C. (2023). Shelf-wide analyses of sand wave migration using GIS: A case study on the Netherlands Continental Shelf. Geomorphology, 424, 108559. https://doi.org/10.1016/j.geomorph.2022.108559
Zijl, F., Zijlker, T., Laan, S., & Groenenboom, J. (2022). 3D DCSM FM: a sixth-generation model for the NW European Shelf. Deltares.
