J. Bootsma1*, B.W. Borsje1 , D. van der Wal1,2, S.J.M.H. Hulscher1
1 University of Twente, the Netherlands; 2 Royal Netherlands Institute for Sea Research (NIOZ), the Netherlands
* Corresponding author: jesse.bootsma@utwente.nl
Introduction
Vegetation on intertidal areas acts as ecosystem engineers by affecting both habitats for species and currents. These vegetated areas are dynamic over space and time, including a changing vegetation extent, shifts in species distribution and changes in vegetation traits such as height and flexibility. All of these affect the ecosystem engineering capacity of vegetated intertidal areas. In this paper, we focus on the impact of intertidal vegetation on currents in an estuary. Central to this study are the spatiotemporal dynamics of vegetation on fringing and mid-channel flats and the effect on currents. Therefore, this paper aims to assess the impact of intertidal vegetation on currents for the Scheldt estuary.
Objective and Methods
A combination of available vegetation maps and remote sensing techniques, together with a hydrodynamic model (Delft3D-FM), is adopted to study this impact. The vegetation maps are derived from Rijkswaterstaat for the Western Scheldt, spanning the period 1993 to 2016 with a frequency of 6 years. These maps provide insights into the total marsh extent and the distribution of species communities. Next to that, Landsat satellite imagery is processed in Google Earth Engine (GEE) to distinguish between marsh, mudflat and open water, based on pixel scale NDVI (vegetation index) and NDWI (water index). Furthermore, the NDVI values are used as a proxy for vegetation density, which, combined with literature-based vegetation characteristics, results in a number of stems per square meter. The vegetation data is then used as input for a hydrodynamic model of the Scheldt estuary, which was previously calibrated and validated by Deltares using a 2013 hindcast (Tiessen et al., 2016). In this study, the impact of vegetated intertidal areas is investigated for a period of calm weather conditions in May 2013 and a period of storm conditions in December 2013 (known as the Sinterklaasstorm).
Results
The vegetation maps show an increase in total marsh extent in the Western Scheldt, from 2483 ha in 1993 to 3350 ha in 2016. This increase is seen for common reed (Phragmites australis) communities, whereas no clear trend is observed for other dominant species communities. Vegetation establishment is especially present at the mid-channel flats Hooge Platen and Plaat van Walsoorden, shifting from a bare to a vegetated flat. When modelling a scenario with spatially uniform vegetation (hv =25 cm, bv = 5 mm, N = 1000 stems/m2, Cd = 1) and comparing this with a bare flat scenario, flow reduction within the vegetated marshes and flow enhancement around the marshes becomes apparent. During storm conditions, the impact of vegetation on flow velocity magnitude is present for the entire estuary just after high tide, while the impact on water levels is only locally (Figure 1). Furthermore, the impact of spatially varying vegetation (multiple species) vs spatially uniform vegetation (single species) is studied as well as a comparison between 1993 and 2016. Between these years, the largest change in vegetation cover is observed, thus the largest difference in the impact on currents is expected. Quantifying the magnitude and extent of intertidal vegetation's impact on currents is useful for our understanding of estuarine hydrodynamics.
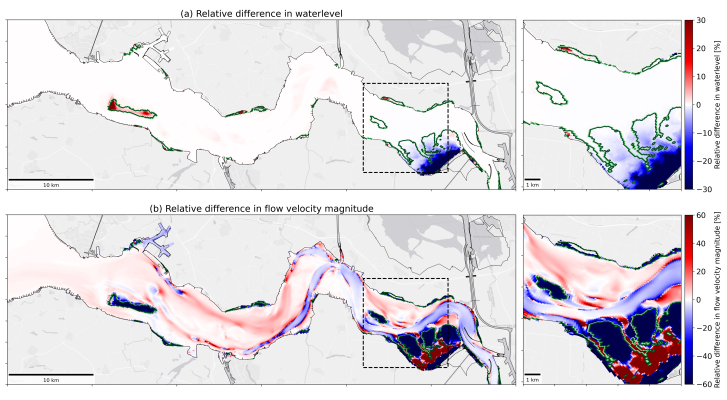
Figure 1: Relative difference ((vegetated – unvegetated)/unvegetated *100) in (a) water levels and (b) flow velocity magnitude during high tide at storm conditions (Sinterklaasstorm 2013), Western Scheldt, the Netherlands. Extent of vegetation is indicated with the green contour lines.
References
Tiessen, M.C.H., Vroom, J. & van der Werf, J.J., (2016), Ontwikkeling van het Delft3D FM NeVla model voor het Schelde estuarium, Deltares
