M. Niemeijer1*, B. Van der Waal1, A. De Beer2, B. Grasmeijer1,2, L. Brakenhoff3, T. Price1
1Utrecht University, 2Deltares, 3Rijkswaterstaat
*Corresponding author: m.r.niemeijer@students.uu.nl
Introduction
Sandy beaches and dunes form the primary flood defences along a large part of the Dutch coast. To ensure sufficient resilience of the beach/dune system to erosion during intense storm conditions, flood risk management is tightly embedded in Dutch national law. Dune safety assessments are formulated in terms of the response to an individual (benchmark) storm occurring in isolation.
However, a storm event might lead to unexpectedly high levels of dune erosion if it occurs in a sequence of storms with insufficient time in between storms for the dune to fully recover. Most research in the field of coastal morphology tends to focus on the effects of single storms on beach morphology. There is relatively little research on the effects of storm sequences and the available literature often presents contradicting results [1]. Some studies report that the erosion potential of storms reduces over the duration of a sequence [2], suggesting that the beach tends to move towards equilibrium, while other studies found elevated erosion volumes for storms that were part of a sequence [3], suggesting that preceding storms destabilised the dune.
Objective and Methods
The aim of this study is to identify patterns in beach/dune behaviour to storms occurring in a sequence compared to storms occurring in isolation. In addition, effects of varying storm chronologies within a sequence are assessed. To achieve this, the morphological response of a 4 km beach stretch near Egmond aan Zee to a series of four storms was tested using a morphological numerical model. A measured storm group from early 2022 (with storms Corrie, Dudley, Eunice, Franklin) of one moderate (5-35 m3/m modelled erosion volume) and three weak storms (0-10 m3/m modelled erosion volume) was simulated using the numerical model XBeach.
The sequence was schematised in XBeach as a series of four storms, without any dune recovery between storms. The modelled dune erosion volume of sequences was compared against the observed dune erosion and the modelled cumulative dune erosion volume of the four individual storms.
Additional simulation runs were performed whereby at the end of each storm the bed level below the dune erosion surface was set back to the initial bed level in an attempt to reduce beach accretion, which was found to be overpredicted by Xbeach.
Results
Comparison of model results to observations showed a good prediction of the dune erosion pattern by XBeach. Sequence simulations with a continuously dynamic beach showed that the erosion potential of storm decreased as the sequence progressed. The total erosion volume of the sequence was approximately 15% less than the cumulative erosion volume of individual storms. Storm order variation did not significantly alter the predicted total erosion volume of a sequence.
The reduction of dune erosion of subsequent storms in a sequence was primarily due to increasing bed level elevation of the sub-aerial beach in the model, receiving an influx of sand from both the eroded duneface and the intertidal bar migrating onshore. The morphological response of the dune to the next storm varied locally, depending on the state of the beach. An eroded beach led to elevated dune erosion volumes by the next storm, while an accreted beach would stabilise the dune (see Figure).
Field measurements from Egmond show that the beach elevation tends to decrease rather than increase during storm conditions. Inter-storm bed level measurements are needed to relate the results of this study to real-world behaviour and to further calibrate the XBeach model for simulation of multiple storms.
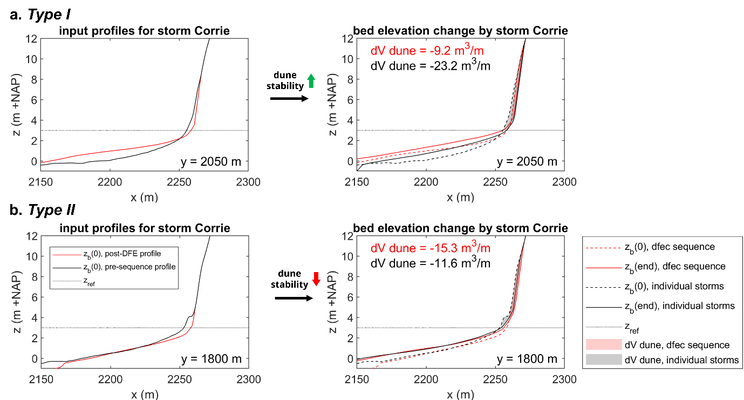
Example of two cross-sections where preceding storms had a different effect on dune stability. Bed level change caused by storm Corrie on two different initial profiles is compared. The black profile represents the measured pre-storm bed level (uneroded profile), the red profile represents the modelled bed elevation after storms Dudley, Eunice and Franklin (eroded profile). a.) Type I response: dune stabilisation by previous storms, more erosion on the uneroded profile. b.) Type II response: dune destabilisation by previous storms, more erosion on the eroded profile.
References
[1] Eichentopf, S., Karunarathna, H. & Alsina, J. M. (2019). Morphodynamics of sandy beaches under the influence of storm sequences: Current research status and future needs. Water Science and Engineering, 12 (3), 221-234. https://doi.org/10.1016/j.wse.2019.09.007 [2].
[2] Senechal, N., Castelle, B., Bryan, K.R. (2017). Storm clustering and beach response. In: Ciavola, P., Coco, G., eds., Coastal Storms: Processes and Impacts. Wiley Blackwell, Chichester, pp. 151e174. https://doi.org/10. 1002/9781118937099.ch8.
[3] Yates, M.L., Guza, R.T., O'Reilly, W.C. (2009). Equilibrium shoreline response: Observations and modeling. J. Geophys. Res.: Oceans 114, C09014. https://doi.org/10.1029/2009JC005359.
