
H. Shafiei1, J. Chauchat1,2*, C. Bonamy1, P. Marchesiello3
1 University Grenoble Alpes, CNRS, Grenoble INP, LEGI, 38000 Grenoble, France; 2 Institute of Engineering University Grenoble Alpes, France; 3 University of Toulouse, LEGOS (IRD/CNES/CNRS/UPS), Toulouse, France
* Corresponding author: julien.chauchat@univ-grenoble-alpes.fr
Introduction
Morphology of sandy beaches constantly interact with the hydrodynamic forces, creating a highly dynamic environment. One of the most common features of these interactions is the creation and migration of sandbars. The sandbars affect the propagation and breaking of the waves leading to changes in wave non-linearity and set-up. The cross-shore pressure gradient caused by wave setup triggers an offshore-directed current (i.e., undertow) which drives the suspended sediments seaward. On the other hand, wave skewness, asymmetry, and streaming move the near-bed sediments shoreward. Furthermore, the entrainment of the sediments depends of the strength of the shear stress exerted on the sandy bottom by the near-bed flows. Consequently, the contribution of the aforementioned mechanisms to the net sediment transport determines the onshore or offshore migration of the sandbars. This is why sandbar migration can be considered as a proxy to morphological evolution of barred beaches and correctly modelling it is crucial in predicting the hydro-morphodynamics of sandy beaches.
Objective and Methods
Robustly predicting the direction of bar migration has been a challenge for coastal engineers either due to high computational costs (in multiple-phase models) or heavy parametrization (in process-based models). The dependency of the process-based models on calibration parameters limits their ability to simulate both erosive and accretive conditions using the same model settings. In the present work, we progressed a step forward in this challenge by implementing an adapted version of the SANTOSS transport formulations (Van der A et al. 2013) in a wave-averaged 3D model (CROCO) (Shafiei et al. 2023). In this model, the near-bed sand transport is calculated using the SANTOSS formulations and the suspended-load transport (both in and above the wave bottom boundary layer) is resolved by the flow model. Note that the current-driven terms in SANTOSS are deactivated to avoid double-counting. Consequently, the effects of waves and currents are taken into account using separate formulations. This led to successful simulation of both onshore and offshore sandbar migration using the same set of tuning parameters. This model is expected to pave the way for the modelers to predict the morphological evolution of sandy beaches under storm and post-storm conditions in one single run.
Results
The model performance is evaluated and calibrated using the data measured in a two-dimensional wave channel. Sections (a) and (b) of Figure 1 illustrate the reference morphodynamic simulations for erosive (LIP1b) and accretive (LIP1c) conditions respectively. The top panel compares the model results with initial and final measured bathymetry; moreover, the middle and bottom panels show the cross-shore bed-elevation variation and sand-concentration profiles across the channel, respectively. These results are obtained using the bedload coefficient of 0.6 and suspended-load coefficient 0.02 kg.m−2.s−1 (run #22 in Figure 1(e)). Besides, to illustrates the robustness of the model to varying calibration parameters, Figures 1(c) and (d) are presented. They illustrate the cross-shore location of the bar and its respective height evolution in both cases of LIP1b and LIP1c using different values of bedload and suspended-load coefficients. In both cases, the model well predicts the sandbar evolution under a wide range of bedload (e.g., 0.4-1) and suspended-load (e.g., 0.015-0.025 kg.m−2.s−1) coefficients. This would provide a more powerful tool to better predict/assess the long-term (e.g., monthly and seasonal) morphological evolution and the resilience of sandy coasts under varying hydrodynamic conditions.
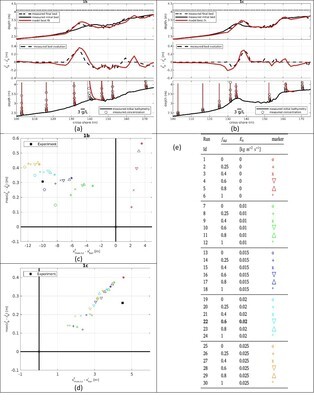
Figure 1: model results. (a)-(b): reference morphodynamic simulations of, respectively, storm and post-storm hydrodynamic conditions using the same model settings. The top panels compare the model final bathymetry with the measured initial and final bed level. The middle panels evaluate the performance of the model to calculate the bed-elevation evolution; the bottom panels illustrate the sediment-concentration profiles at different cross-shore locations. (c)-(d): Distribution of the bar height evolution versus bar migration (between final and initial bed profiles) under different values of bedload and suspended-load coefficients. The corresponding values set for each marker are listed in (e); markers of the same shape and color show the effects of suspended-load and bedload coefficients respectively. Run #22 is the reference case.
References
Van der A, D. A., Ribberink, J. S., van der Werf, J. J., O'Donoghue, T., Buijsrogge, R. H., & Kranenburg, W. M. (2013). Practical sand transport formula for non-breaking waves and currents. Coastal Engineering.
Shafiei, H., Chauchat, J., Bonamy, C., & Marchesiello, P. (2023). Adaptation of the SANTOSS transport formula for 3D nearshore models: Application to cross-shore sandbar migration. Ocean Modelling, 181, 102138.
