R.C. Sonnemans1,2*, L. Portos-Amill1 , T. van Engelen2, S. Cuevas Salgado2, P.C. Roos1
1 University of Twente, the Netherlands; 2 Witteveen+Bos, the Netherlands
* Corresponding author: r.c.sonnemans@gmail.com
Introduction
The North Sea is heavily occupied by shipping, military zones, energy production, oil and gas installations, sand extraction areas, but also extensive subsea infrastructure, including over 4500 km of pipelines on the Dutch Continental Shelf alone (Rijkswaterstaat, n.d.). However, its environment is highly dynamic, mainly driven by waves, tides, and a constantly evolving sandy seabed with bedforms of various scales. Such dynamics can complicate burial depth prediction, and increase pipeline vulnerability (Larsen et al., 2019).
This study focuses on megaripples, with heights H~0.01-0.1 m, lengths λ~1-10 m, and migration rates up to 100 m/year (Larsen et al., 2016). Megaripples commonly occur superimposed on sand waves (Passchier & Kleinhans, 2005), and where sand waves are absent or relatively stable, megaripples constitute short-term seabed changes (Larsen et al., 2016). Although interactions between some bedforms (e.g. sand waves) and pipelines are studied (Morelissen et al., 2003; Zhang et al., 2025), the relationship between megaripples and pipelines remains poorly understood, mostly due to data or processing limitations.
This study aims to (1) address reliability constraints in bedform characterization, and (2) determine relationships between a North Sea pipeline, the environment, and nearby megaripple geometry derived from pipeline monitoring data.
Objective and Methods
To assess reliability constraints in bedform characterization, this study proposes a robust characterization procedure that eliminates scale or orientation assumptions, while reducing subjective interpretation and computational demand. The method is validated on 104 artificially generated bathymetries including phase-modulated, (a)symmetric bedforms, noise and a background slope. To improve reliability, transects extracted from the bathymetry are classified as invalid if their autocorrelation peak is below 0.3, and, a bathymetry is considered non-characterizable if it contains fewer than 10 valid transects.
Following validation, the characterization is applied to 2024 pipeline monitoring data, covering a length of 200 km, and a width of ±30 m on either side of the pipeline at 0.2 m resolution. Here, megaripple geometry including length (λ), height (H), asymmetry (ã), orientation (θ) and three-dimensionality is quantified along the pipeline, split into sections with equal pipeline conditions.
Using literature, observations, survey reports, pipeline information and datasets such as sediment classifications, relationships between the pipeline, detected megaripple geometry and the environment are determined.
Finally, the characterization is applied to 2016, and 2018 survey data, each with ±25 m and ±40 m of data on either side of the pipeline, to evaluate the dependency of detected megaripples and relationships on observation date.
Results
After successfully validating the characterization method, megaripples are characterized along 2024 pipeline survey data, examples of which are shown in Figure 1. This reveals a contrast in megaripple geometry across the Strait of Dover. The Dutch sector is characterized by relatively uniform megaripple dimensions, with lengths around 6 m and heights of roughly 0.2 m. However, the English sector exhibits greater variability, with length ranging between 4 and 9 m and frequent peaks exceeding 15 m. This increased geometric variability appears to coincide with greater variation in seabed elevation and more intermittent pipeline exposure, both of which are more evident on the English side of the strait.
In addition, a spatial trend in megaripple orientation is observed across the Southern Bight, gradually transitioning from North-West to North-East towards the Netherlands. Similar to the length and height, orientation on the English side is more irregular, including localized sections where the orientation shifts southwards, which correspond to areas of low asymmetry (±0.1).
Upon further analysis, this study is expected to show variations, trends and clusters in detected megaripple geometry along the pipeline, which may depend on pipeline conditions. Further analysis should also reveal underlying patterns between megaripples geometry, hydrodynamic or sedimentary conditions.
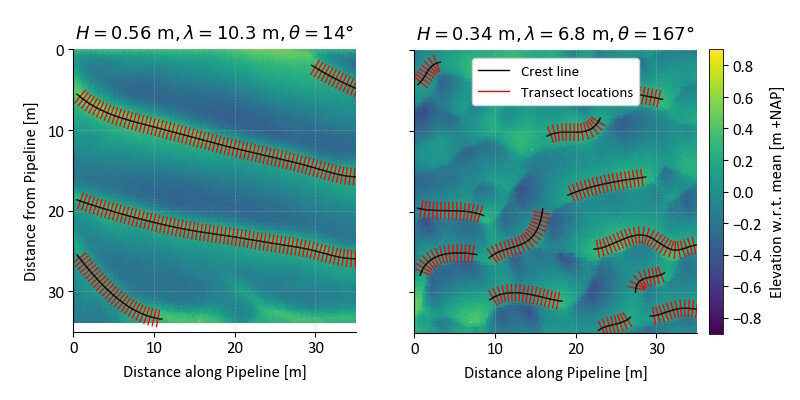
Figure 1: Two example megaripple characterizations for bathymetries extracted from 2024 pipeline monitoring data in the North Sea. The characterization of the bathymetries is performed based on extracted transect profiles at the indicated transect locations (red lines) along identified crest lines (black lines). Here, the pipeline is buried and located along y=0.
References
Larsen, S., Roulund, A., Brooks, A., & Chaffey, A. (2016). Sandwaves and megaripples at Race Bank (UK) Offshore Wind Farm. 8th International Conference on Scour and Erosion. https://api. semanticscholar.org/CorpusID:55097697
Morelissen, R., Hulscher, S. J., Knaapen, M. A., Németh, A. A., & Bijker, R. (2003). Mathematical modelling of sand wave migration and the interaction with pipelines. Coastal Engineering, 48 (3), 197–209. https://doi.org/10.1016/S0378-3839(03)00028-0
Passchier, S., & Kleinhans, M. G. (2005). Observations of sand waves, megaripples, and hummocks in the Dutch coastal area and their relation to currents and combined flow conditions. Journal of Geophysical Research: Earth Surface, 110 (F4). https://doi.org/10.1029/2004JF000215
Rijkswaterstaat. (n.d.). Functions and use - Noordzeeloket. https://noordzeeloket.nl/en/functions-use/
Zhang, B., Draper, S., An, H., Jiang, H., & Cheng, L. (2025). Influence of bed ripples on scour-induced span elongation of pipelines/cables. Coastal Engineering, 201, 104777. https://doi.org/10.1016/J.COASTALENG.2025.104777
