M.V. Reyes Castillo1*, V. Kitsikoudis1 , S.J.M.H. Hulscher1
1 University of Twente, Faculty of Engineering Technology, Water Engineering and Management, Enschede, The Netherlands
* Corresponding author: m.reyes@utwente.nl
Introduction
Estuaries are dynamic transition zones between river and marine systems. This convergence generates salinity gradients, so estuaries act as zones of salt storage and redistribution through estuarine circulation and mixing processes (Geyer & MacCready, 2014). Bathymetric depressions amplify stratification by retaining dense water in the deepest zones (Kranenburg et al., 2022). In such cases, vertical exchange depends on the density gradients, local geometry, and external forcing. In closed or semi-closed estuaries, tidal exchange is reduced by hydraulic structures, such as storm surge barriers with floodgates. As a result, river discharge and wind forcing become more important drivers of mixing and salinity redistribution.
The Haringvliet estuary is located in the Rhine–Meuse delta in the Netherlands. The Haringvlietdam controls the exchange with the North Sea via floodgates. The bathymetry retains an estuarine morphology (ebb–flood channels separated by shoals; Figure 1), although saltwater inflow has been restricted since the Haringvlietdam closure in 1970 (Ferguson, 1971). This study shows field observations from two bottom depressions (D and F1; Figure 1).
Objective and Methods
The objective is to compare the vertical velocity structure between the two bottom depressions. Field measurements were conducted during three campaigns between November 2022 and March 2023. Campaigns 1 (10 Nov–23 Dec 2022) and 2 (20 Dec 2022–23 Jan 2023) were carried out in bottom depression D, while campaign 3 (24 Jan–13 Mar 2023) was conducted in bottom depression F1. Conductivity–Temperature–Depth (CTD) sensors recorded salinity and density at multiple vertical levels within each bottom depression (Figure 1). Two high-frequency bottom-mounted Acoustic Doppler Current Profilers (ADCPs) measured velocity throughout the water column to investigate how the velocity profiles change along each depression during flushing events (Figure 1). Additional ADCPs were deployed outside of the depressions to measure the incoming flow velocities. Salinity was computed from conductivity, temperature, and pressure using the UNESCO formulation. All time series were resampled to a common temporal resolution. Velocity data were quality-controlled and rotated into the principal channel direction. The density interface was estimated from velocity and salinity gradients and compared between upstream and downstream ADCP locations within each depression to characterize interface displacement over time. Discharge at the Haringvlietdam and wind data were used as external forcing parameters.
Results
Bottom depression D showed persistent stratification during campaigns 1 and 2, with a persistent two-layer configuration and a stable pycnocline. Near-bed salinity remained elevated (~5 PSU), while the upper layer stayed relatively fresh. Along-channel velocity profiles showed higher velocities in the upper layer and weak motion near the bed. During high-discharge periods, shear intensified and the pycnocline displayed larger vertical variability. Bottom salinity decreased and became more variable, suggesting enhanced entrainment and vertical exchange. However, the dense bottom layer remained, indicating that stratification was strong enough to prevent complete removal of near-bed salinity. In contrast, bottom depression F1 exhibited weak and intermittent stratification during campaign 3. Bottom salinity was generally low (with a maximum of ~1.5 PSU), and velocities were more vertically uniform, indicating weaker vertical stratification and the absence of a sustained two-layer structure. Salinity increases near the bed occurred during energetic discharge or wind events and typically persisted for several tidal cycles before being redistributed. Pycnocline displacements were smaller and less sustained than in depression D, consistent with limited salt retention. Overall, the observations indicate that bottom depressions within the same estuary can exhibit markedly different stratification persistence and exchange dynamics under comparable external forcing
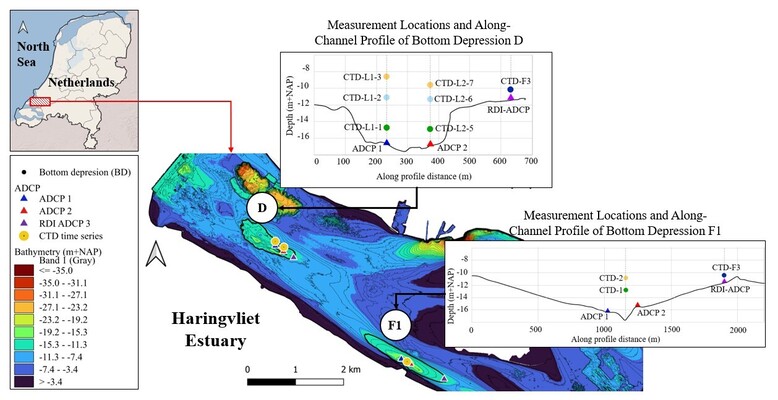
Figure 1. Overview of the Haringvliet estuary and measurement configuration for bottom depressions D and F1. The main panel shows bathymetry (m + NAP) with color-coded depth classes and the locations of the two bottom depressions. Instrument deployments are indicated by symbols: ADCPs (triangles), and CTD time-series stations (circles). Insets display the along-channel bathymetric profiles for bottom depression D (top) and bottom depression F1 (bottom), including the relative positions and depths of the deployed instruments.
References
Ferguson, H.A., (1971), De Afsluiting van het Haringvliet 1971. TU Delft Repository.
Geyer, W.R., and MacCready, P., (2014), The estuarine circulation. Annual Review of Fluid Mechanics, 46, 175–197.
Kranenburg, W.M., Tiessen, M.C.H., Blaas, M., and Van Veen, N.P., (2023), Circulation, stratification and salt dispersion in a former estuary after reintroducing seawater inflow. Estuarine, Coastal and Shelf Science, 282, 108221.
