A.J. Hillen-Schiller1, W. Sonke2, E.P.L. Elias3, A.J.F. van der Spek1,3, M.G. Kleinhans1
1 Utrecht University, Netherlands; 2 TU Endhoven, Netherlands, Deltares, 3 Netherlands
* Corresponding author: a.j.hillen-schiller@uu.nl
Introduction
The recently published channel detection toolbox TopoTide (formerly TTGA; Sonke et al., 2022) presents an opportunity for automating sediment budgeting in estuaries, at the same time refining the scale on which the budget is analysed relative to current methodology (e.g., Elias et al., 2023). The detected channels can be used to determine the boundaries of bars (sediment stocks) in the estuary. By comparing changes in the channel network over time to those in bar morphology, we can start to disentangle the mechanisms involved in bar morphodynamics, e.g., quantifying lateral (channel migration) vs. vertical sedimentation (van Straaten, 1954). Before we can answer questions like where does the sediment flow or why do we see these changes in this bar, we must first ask: at what scale(s) do we want TopoTide to extract channels? While several external definitions might reasonably be used to select channels based on morphology (e.g., depth) or function (e.g., transport capacity), this work searches for characteristics in the available data (see Objectives and methods) which distinguish (groups of) channels that might be useful for different analyses and at different scales.
Objective and Methods
The current work aims to identify relationships among quantifiable characteristics of autodetected channel networks and other morphological quantities in the estuary. We ask whether these relationships highlight channels or networks at a given scale, and consider the usefulness of these scales for sediment budgeting purposes.
The Western Scheldt estuary, south-western Netherlands, is used as a study case. A set of 48 bathymetries, collected by Rijkswaterstaat between 1955-2023, is used to study morphological changes in the estuary over time. These data were collected at intervals of 1-2 years, affecting the spatial scales at which changes can be meaningfully tracked through time.
TopoTide is used to extract channel networks from these bathymetries. TopoTide assigns each detected channel a significance value, termed δ, which is a characteristic volume and thus represents the spatial scale associated with that channel. The main channel always has . We compare this value with other channel characteristics. We further investigate the characteristics of channel networks composed only of channels with δ values above a certain threshold.
Results
- Comparing channel lengths to their respective values (Fig. 1a), two distinct clusters emerge. These represent the two major secondary channels in the estuary. The cluster marked in red in the figure contains instances of both these channels throughout the timeseries, while the one marked in green represents only one of the two, specifically in the period 2005-2022. This likely corresponds to the period in which this channel was regularly dredged, which would also explain the low variability in channel length. Together with the main channel in the estuary, these can be used to divide the estuary into major bars for sediment budgeting.
- Comparing length (Fig. 1b) and channel count (Fig. 1c) of networks with different thresholds, clear changes in trend are visible for thresholds below , as well as increased variability. Networks above this threshold are composed of a main channel, two secondary channels (as above), as several tertiary channels. The latter may prove useful for localised budget analyses, e.g. with reference to local tidal levels, which vary along the estuary.
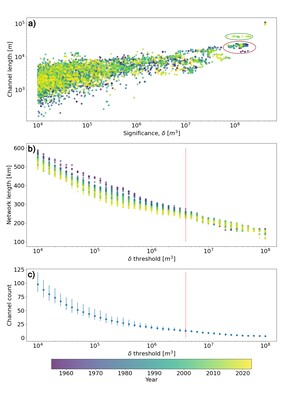
a) Channel length vs. significance, coloured by year. The cluster in the top right is that of the main channel in each year (these all have the same significance by definition). b) Lengths of networks based on different δ thresholds. Colours represent years. Note that below δ = 4·10^6, network length appears to decrease consistently through time. c) Mean and range of number of channels in networks based on different δ thresholds. Note, below δ = 4·10^6 the shape of the mean curve changes, and the spread increases substantially.
References
Elias, E.P.L., Spek, A.J.F.V. der, Wang, Z.B., Cleveringa, J., Jeuken, C.J.L., Taal, M., Werf, J.J.V. der, 2023. Large-scale morphological changes and sediment budget of the Western Scheldt estuary 1955–2020: the impact of large-scale sediment management. Netherlands Journal of Geosciences 102, e12. https://doi.org/10.1017/njg.2023.11
Sonke, W., Kleinhans, M.G., Speckmann, B., van Dijk, W.M., Hiatt, M., 2022. Alluvial connectivity in multi-channel networks in rivers and estuaries. Earth Surface Processes and Landforms 47, 477–490. https://doi.org/10.1002/esp.5261
van Straaten, L.M.J.U., 1954. Composition and structure of recent marine sediments in the Netherlands. Leidse Geologische Mededelingen 19, 1–108.
