A. Kroon1*, M. Niemeijer1, Y. Attema1, B. Huisman2, D. Roelvink2,3
1 Svašek Hydraulics, The Netherlands; 2 Deltares, The Netherlands; 3 IHE Delft, The Netherlands
* Corresponding author: kroon@svasek.com
Introduction
Maasvlakte 2 is a seaward extension of the Port of Rotterdam, constructed between 2008 and 2012. The southern part of the sea defence of Maasvlakte 2 consists of an 8 km-long, convex sandy coast comprising of a foreshore, beach and dune at a location where the original seabed was about -20 m+NAP. The northern beach section faces northwest, and the southern section faces southwest. The curved transition between these sections has a curvature of 0.03 degrees/m and is subject to significant erosion. To maintain the volume of sand in the sea defence, regular sand nourishments of, on average, 700.000 m3/y are placed.
Multiple processes this human-made coast simultaneously. The curvature of the coast introduces a gradient in alongshore sediment transport. Since construction, the dune volume has increased by an average of 10-30 m3/m/y due to eolian sediment transport. Yet, since 2021, the dune volume has occasionally decreased locally due to dune erosion. During a regular spring tide, tidal currents can reach 1.25 m/s. Modelling these combined processes can, in theory, demand significant computational resources. Yet, the management challenges involved call for a practical tool to evaluate options related to the timing, location, and lifespan of sand nourishments.
Objective and Methods
ShorelineS is an equilibrium one-line model that predicts coastline changes driven by wave-induced sediment transport. It incorporates empirical formulas for processes like eolian transport, dune erosion, and tide-driven sediment movement, making it a useful coastal management tool for Maasvlakte 2's sandy coast. This study aims to evaluate ShorelineS at Maasvlakte 2, focusing on the relevance of these added processes for model accuracy.
The model is set up using yearly profile measurements between -20 m+NAP and the landward boundary of the dune. The model tracks the volume-weighted 0 m+NAP shoreline position. Tidal forcing is derived from a FINEL2D hydrodynamic model, and offshore wave conditions at Europlatform are transformed to nearshore conditions at the −20 m NAP contour of Maasvlakte 2 using a dedicated wave transformation procedure.
Calibration involves 2500 30-min runs using the GLUE method to assess volume change, shoreline position, and dune volume, similar to Kroon et al. (2025). This generates probability distributions for parameters, including wave transport scaling (Sw), tidal transport scaling (Su), dune erosion rate Cs, bedslope, eolian transport (Kw), and active profile height, which influences coastline and volume responses.
Results
The overall model performance is very good for the central eroding part of Maasvlakte 2 (Figure 1). Including tide in the computation significantly improves model performance (BSS increase with 0.1-0.2). Yet, the scaling of wave transport is most important, with higher model skill for an amplification factor of ~0-20% on wave transport. The active profile height appears less important for predicting volume changes, but is very important for the performance of the coastline change. For the overall model performance, the dune settings are of minor importance because the volumetric flux to the dune is an order smaller than that of the alongshore transport. This suggests that dune processes do not need to be included to achieve good predictions of volume changes or coastline position. Best performance of predicted dune volumes was achieved when a bed slope of 1:30—1:50 is used and a Cs value between 5e-6 and 1.5e-4 is used, which is respectively a factor 100 and 3 smaller than default.
These model results emphasise that a fast, empirically based model like ShorelineS can accurately predict volume and coastline changes while accounting for the complex processes governing open-coast evolution.
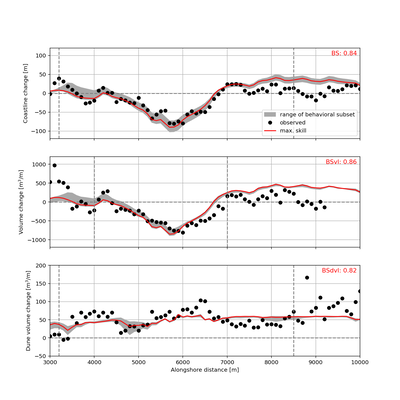
ShorelineS model results for coastline change (top), volume change (middle) and dune volume change (bottom) compared to observed changes (black dots) in the period 2013-2016. Left is the northern end and right the southern end of the Maasvlakte 2 coast.
References
Kroon, A., Christiaanse, J.C., Luijendijk, A.P., de Schipper, M.A., Ranasinghe, R. (2025). Parameter uncertainty in medium-term coastal morphodynamic modeling. Scientific Reports 15 (1), 1-15.
