I. Faizal1,2*, E.M. Horstman1 , K.M. Wijnberg1
1 University of Twente, Netherlands; 2 Universitas Padjadjaran, Indonesia
* Corresponding author: i.faizal@utwente.nl
Introduction
Coral reefs play several crucial roles as coastal ecosystems in shallow tropical waters. One of its functions is as a natural wave buffer, effectively reducing the wave energy of incoming ocean waves. Theoretically, waves undergo greater attenuation when passing over coral reefs with a denser coral cover. Coral cover varies considerably across different locations, with more than 500 coral species identified in tropical regions [1]. Quantification of coral cover in relation to wave attenuation is often done using the bed roughness approach. The friction coefficient Kf provides a simple quantification of the contribution of reef-related bed roughness in wave transformation. Kf and the associated friction factor ƒw summarize how strongly the reef system reduces waves, linking dissipation mechanistically to roughness. Previous research has shown that friction factors can vary from 0.4 for low coral cover (<10%) to 5 for high coral cover (50-90%) [2]. Beyond the coral cover, coral reefs can vary greatly in structural complexity of the shape and structure of the constituting corals. However, the roughness effects of highly complex coral reef compositions remain overlooked. This study investigates how the structural complexity of coral reefs influences the transformation of incoming waves across the reef zones of a highly diverse coral reef.
Objective and Methods
This research investigates the role of highly diverse coral reefs on wave transformation. Our study site is Kri Island, located in the Coral Triangle in Raja Ampat, Indonesia (Figure 1a). Local wave properties were measured across different reef zones along three transects (T1-T3) on the north coast of the island (Figure 1b). The data were obtained through a six-week field campaign conducted from April to May 2024. Pressure sensors were simultaneously deployed at the three distinct reef zones along each transect (Figure 1c). The coral reefs were mapped using the extended Line Intercept Transect (LIT), measuring the dimensions of the various coral lifeforms. The resulting reef length (B) was divided by the wavelength (L) to represent the Relative Reef Length (B/L) for further friction analysis.
Wave data were processed using Spectral Analysis [3]. The observed wave transformation between the reef zones along the transect is used to compute the friction coefficient Kf —interpreted such that (Kf<1) denotes a frictional role in wave attenuation. The associated friction factor ƒw is correlated with the coral cover as well as the relative reef length across different reef zones, and the relationship between the complexity of coral reefs and the determined friction factor.
Results
The results show variations in coral cover between transects ranging from 14.8% (T1) to 83.2% (T3). Variations in coral lifeforms affected the reef lengths along the LITs, with values ranging from 151 to 792 m. Incoming wave heights were generally low, with maximum recorded wave heights of 0.16 m and an average wave height of 0.05 m with significant wave shoaling along the shallow transect.
The spectral analysis shows the wave climate has an average period between 8 and 11 seconds across all zones and transects. (Figure 1d). The wave energy density is comparatively low at both the reef crest and reef flat, with modest peaks in the swell band (~0.05–0.1 Hz). The spectral plot shows a decrease in density from the reef crest to the reef flat. This also applies to observations at other transects with higher coral cover. The friction coefficient Kf systematically decreased with increasing relative wave height Hs/h at T2, implying stronger frictional dissipation as wave heights increase relative to the water depth (Figure 1e). The correlation between coral cover and friction factors ƒw shows a slightly positive relationship where the ƒw value reaches 5 at coral cover around 25%.
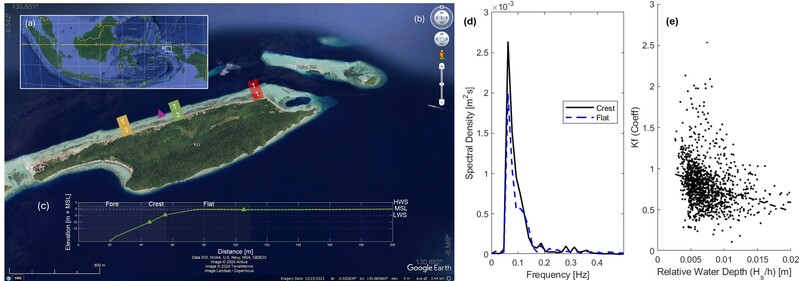
Figure. a) Site Location in Raja Ampat, Indonesia; b) Kri Island with three transects; c) Cross-shore profile at transect T2 with green triangle indicating pressure sensors; d) Spectral Density for the reef crest and reef flat at T2 and e) Friction coefficient Kf to relative water depth Hs/h for same transect.
References
[1] ADB, Regional state of the Coral Triangle - Coral Triangle marine resources: Their status, economies, and Management. 2014. [Online]. Available: http://www.adb.org/sites/default/files/publication/42393/regional-state-coral-triangle.pdf
[2] J. S. Rogers, S. G. Monismith, D. A. Koweek, and R. B. Dunbar, “Wave dynamics of a Pacific Atoll with high frictional effects,” J. Geophys. Res. Ocean., vol. 121, pp. 350–367, 2015, doi: 10.1002/2015JC011170.Received.
[3] bruce J. Hegge and G. Masselink, “SPECTRAL ANALYSIS OF GEOMORPHIC TIME SERIES AUTO‐SPECTRUM,” Earth Surf. Process Landforms, vol. 21, pp. 1021–1040, 1996.
