
A.M. Albrecht1,2*, C.H. Lashley1, J.D. Bricker1, C.M. Ferreira3
1 Delft University of Technology, 2 Fulbright U.S. Student Program, 3George Mason University
*This email address is being protected from spambots. You need JavaScript enabled to view it.
Motivation
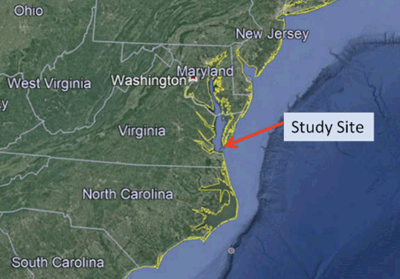
Figure 1 Aerial view of the Chesapeake Bay study site. Source: Google Earth
As climate change causes sea levels to rise, coastal communities must continue to improve their flood defense systems to withstand wave activity created by extreme storm events. Energetic waves can reach shore and cause dangerous flooding, the risk of which will increase with rising seas. To defend coastal communities, new flood control methods are being explored. One such method is using vegetated foreshores like salt marshes to attenuate wave energy before the waves reach the shoreline.
The approach of using salt marshes as flood control can be applied to the northeastern United States (US), an area that is at an increasing risk for storm-related flooding as warmer temperatures cause both an increase in large storms in the Atlantic Ocean and an increase in sea levels. This project will focus on the northeastern coast of the US and create a two dimensional model of a study site in the Chesapeake Bay, seen in Figure 1, using the XBeach numerical model. The site has previously been modeled by Baron-Hyppolite (2018) using SWAN, a wave phase-averaged model. Modeling in XBeach will extend this project to include a wave-group resolving analysis of the site.
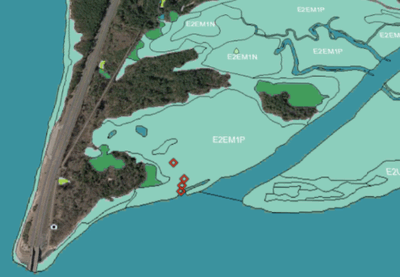
Figure 2 Aerial view of the study site vegetation, with sensor locations in red. E2EM1P represents a salt marsh. Source: Google Earth and National Wetlands Inventory
Aims
The model of the study site will be used to evaluate the extent that XBeach accurately predicts wave propagation over shallow vegetated foreshores. It will also be used to study the effect of salt marsh vegetation characteristics on wave attenuation in the foreshore.
Methods
The XBeach model has been created using field data from collaborators at George Mason University (GMU) in Virginia taken during a series of storm events between September 24th and October 2nd of 2015. GMU provided pressure gauge data, ADCP data, bathymetry, and vegetation characteristics. Boundary conditions for the XBeach model are taken from the ADCP and pressure gauge data.
The model will be validated by comparison to GMU site data taken at four locations along a transect. After validation, the site will be modelled with a base vegetation setup based on the GMU vegetation survey and the National Wetlands Inventory map shown in Figure 2. Then, following the approach used by Hu et al. (2015) the stem height and density of this base vegetation will be varied from 50% to 200% in 25% intervals. Preliminary results will be presented.
Baron-Hyppolite, C., (2018). “Simulation of Nearshore Process and Testing of Implicit and Explicit Vegetation Representation in SWAN.”
Hu, K., Chen, Q., Wang, H.. (2015). “A numerical study of vegetation impact on reducing storm surge by wetlands in a semi-enclosed estuary.” Coastal Engineering . 95, 66-76.
U.S. Fish and Wildlife Service. Septermber 21st, 2017. National Wetlands Inventory website. U.S. Department of the Interior, Fish and Wildlife Service, Washington, D.C. http://www.fws.gov/wetlands/