
V. Dagalaki1*, F. Scheel1, W.P. de Boer1,2, A. Kroon2,3, S.G.J. Aarninkhof 2
1 Deltares, 2 Delft University of Technology, 3 Svašek Hydraulics
* This email address is being protected from spambots. You need JavaScript enabled to view it.
Introduction
Morphodynamic process-based models are widely used to estimate coastline position change and support the decision-making process for adaptation/mitigation measures. However, the outputs of these models are characterised by uncertainty originating from, among other sources, forcing variability and parameter imprecision. Currently, this uncertainty is mostly assessed qualitatively, using sensitivity analyses for computationally intensive models, while fully probabilistic analyses have been applied to single, computationally less expensive models. Yet, no approach has been presented in literature for the quantification of the uncertainty in coastline change estimates under the joint effect of different physical processes that are simulated using different models. This gap is addressed in this study.
Methods
A case study in Anmok beach, South Korea is considered, focussing on relevant processes acting upon future coastline positions, and their respective timescales. Delft3D and UNIBEST-CL+ models are respectively used to simulate the impact of a small-scale intervention and large-scale coastline dynamics. Firstly, empirical distributions of coastline change are derived using the selected models associated with the different physical processes. Subsequently, a Monte Carlo convolution approach is applied to aggregate the derived probability distributions. The method is used to quantify the effects of alternative human interventions on the cumulative coastline change probabilities.
Results
This method allows us to obtain information that was previously unavailable: quantified estimates of coastline change uncertainty under the combined effect of different physical processes simulated with the different models. The advantages of the studied aggregation approach include speed, ease of implementation and comprehensibility. The results of the case study (Figure 1) allow us to assess which intervention design preforms best, based on the aggregated distributions of coastline change, reflected against a set of probabilistic indicators. These indicators can be defined to quantify the effectiveness of different intervention designs. Finally, this method constitutes the first step towards risk-based intervention planning and assessment.
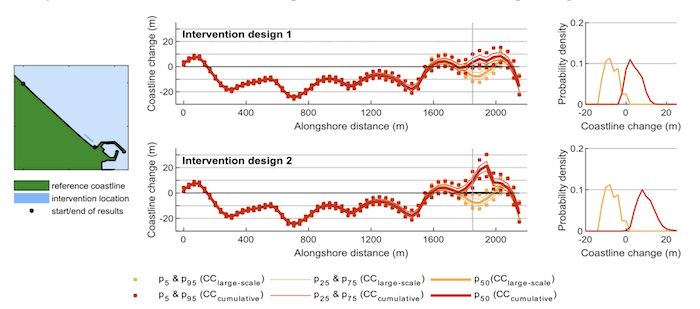
Figure 1. Overview of Anmok beach (left panel), alongshore distribution of coastline change percentile estimates for two alternative intervention designs (centre panels), probability distributions of coastline change for one location (left panels) marked by the grey vertical line on the centre graphs. Red indicates the effect of the large- scale processes, while yellow indicates the combined effect of the large-scale processes and intervention impact.