
B.E. Larsen1*, D.A. van der A2, J. van der Zanden3, G. Ruessink4, D.R. Fuhrman1
1 Technical University of Denmark, This email address is being protected from spambots. You need JavaScript enabled to view it., This email address is being protected from spambots. You need JavaScript enabled to view it.
2 University of Aberdeen, This email address is being protected from spambots. You need JavaScript enabled to view it.
3 MARIN, Zanden, This email address is being protected from spambots. You need JavaScript enabled to view it.
4 Utrecht University, This email address is being protected from spambots. You need JavaScript enabled to view it.
Introduction
Accurately predicting cross-shore sediment transport remains a challenging task as it comprises many physical processes, which are often comparable in magnitude, but vary in terms of sign. Numerical wave tanks using Reynolds-Averaged Navier-Stokes (RANS) turbulence models can potentially resolve many of these processes, and may be used as powerful tools to study the detailed sediment transport processes, which are often difficult to measure in the laboratory and field. In past studies using RANS models to simulate waves, there has been a tendency to overestimate turbulence, however. This problem was solved by Larsen and Fuhrman (2018), where significant improvements in predicted turbulence levels and undertow profiles for a simulated model scale experiment were demonstrated. In this work, the new model will be used to simulate a large-scale experiment with a special focus on hydrodynamic processes relevant for cross-shore sediment transport, such as wave boundary layer flow, undertow and turbulence.
Methods and Results
A recent experimental campaign conducted in a 100 m long wave flume involving bichromatic waves breaking over a fixed bar (van der Zanden et al., 2019) will be simulated using the OpenFOAM solver waves2FOAM (Jacobsen et al. 2012), combined with the model by Larsen and Fuhrman (2018).
Figure 1 shows a comparison between the experimental and modelled undertow. The model importantly captures the transition in the vertical undertow structure going through the outer surf zone (54 m< x < 60 m), where the undertow goes from having largest negative velocities far from the bed to having largest negative velocities near the bed. This could not be achieved using a standard RANS model. The model results will be compared in detail with experimental results for water surface elevations, velocities and turbulence, and implications for cross-shore sediment transport will be discussed (to be presented).
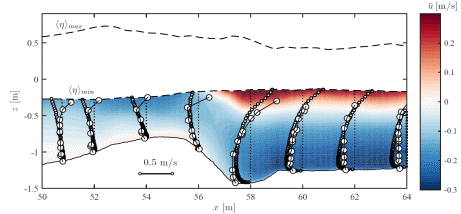
Figure 1. Spatial distribution of the time-averaged velocity of the measurements from van der Zanden et al. (2019) (large circles) and from the model (small circles and colored velocities)
References
Jacobsen, N. G., Fuhrman, D. R. & Fredsøe, J., 2012. A wave generation toolbox for the open-source CFD library: OpenFOAM (R). Int. J. Numer. Meth. Fluids 70, 1073–1088.
Larsen, B. E. & Fuhrman, D. R. (2018) On the over-production of turbulence beneath surface waves in Reynolds-averaged Navier-Stokes models. J. Fluid Mech. 853, 419-460.
van der Zanden, J., van der A., D. A., Cáceres, I., Larsen, B. E., Fromant, G., Petrotta, C., Scandura, P. & Li, M. (2019). Spatial and temporal distributions of turbulence under bichromatic breaking waves. Coast. Eng. 146, 65-80.