G. Hagenaars1, A. Luijendijk1, S. van Heteren2,*, R. van Ede2, TJ.M. van de Ven2, J.M.M. Hettelaar2
1 Deltares
TNO - Geological Survey of the Netherlands, * This email address is being protected from spambots. You need JavaScript enabled to view it.
Introduction
Traditionally, coastline-migration maps have been made using field-monitoring data, supplemented locally by analyses of aerial photography. The EMODnet Geology coastline-migration map is a good example. It provides an overview of our current knowledge and is useful in transnational coastal-zone management. At the same time, it is far from perfect. First, it combines monitoring series from different time periods and at varying spatial scales, necessitated by an overall scarcity of data. Second, it includes data gaps as many remote regions have never been surveyed. Third, the coastline is not a single line that is easily and consistently recognized and used. Along sandy coasts, one can map the low-tide line, the high-tide line and the dune foot, and each of these indicators may behave differently through time. Along bluff and cliff coasts, one can map the bluff/cliff top and base, or the actual low- or high-water line some distance away. When part of a bluff or cliff collapses and thus recedes landward, its rubble accumulates at the base, moving the water line seaward.
Approach
The public availability of satellite data and new analytical tools for processing big data, such as the Google Earth Engine, enable us to look at coastline migration in a new way. Scripts for automated detection of the land-water boundary generate numerous data points for each part of the European coastline. When averaged by year and analyzed for a decadal period, these data points form the basis for a new pan-European coastline-migration map that covers a consistent time period relevant for present-day coastal-zone management, eliminates data gaps, and portrays a single coastline indicator that is assumed to correspond to the mid-tide land-water boundary.
Result and outlook
As part of EMODnet Geology, tens of thousands of transects with a spacing of 500 meters were analyzed, giving a map resolution of 1:1,000,000 at maximum zoom level, and generalized for online viewing at larger scales up to a pan-European view (Figure 1). As the pixel resolution of individual satellite images is about 10 meters, the precision of the method is still limited. Calculating annual averages from multiple measurements made within a single year reduces this uncertainty, and validation for sandy coastlines with beaches shows the method’s accuracy. For bluff, cliff and muddy coasts, such validation and further analysis still need to take place. Now published as an EMODnet web service on the EMODNET Geology Portal (https://www.emodnet-geology.eu/map-viewer/), we are keen to invite all users to evaluate our satellite-based output with corresponding field-monitoring data.
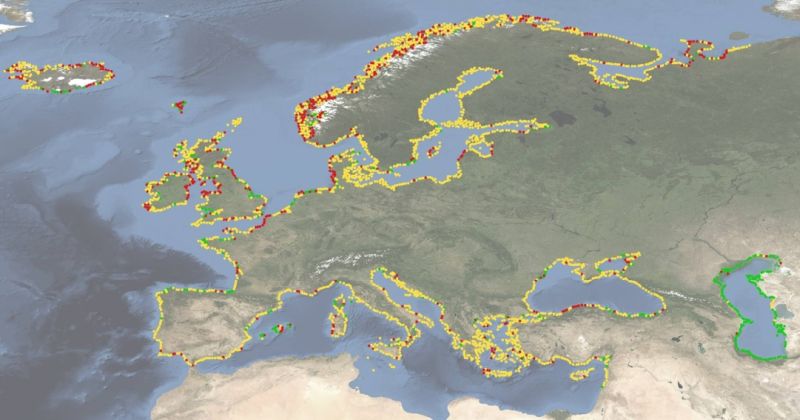
Figure 1 Zoomed-out view of the EMODnet data product at a pan-European scale. Accretion is denoted in green, stability in yellow, and erosion in red.