
C.M. van der Hout1*, T. Gerkema1, R. Witbaard1
1 NIOZ Royal Netherlands Institute for Sea Research, Department of Estuarine and Delta Systems (EDS), and Utrecht University, P.O. Box 140, 4400 AC Yerseke.
Introduction
SPM passing the Southern Bight mainly originates further ‘downstream’ of Dover Strait and by cliff erosion in that area. Along the continental coast of the Southern Bight, the alongshore transport of SPM is estimated to be 22 Mton/yr on average, but can fluctuate by a factor of two. We will focus on a part of the route of SPM through the southern North Sea where concentrations were found to be high: in the turbidity maximum zone (TMZ), which stretches between 0.5 and 3 km from the coastline.
Methods
A dataset from a lander frame located in the middle of the TMZ forms the basis of this work. It was situated 1.2 km off the coast near Egmond, for the project ‘Monitoring and Evaluation Program Sand
mining’ commissioned by the La Mer Foundation. The research has been done in the framework of the BwN NTW3.2 project. Attached to the frame were four SPM concentration sensors, one near-bed point velocity sensor, a CTD and an upward looking ADCP. The SPM concentration at the top of the frame is used as a continuous calibration to convert the acoustic backscatter of the ADCP to SPM concentrations. Thereby the transport of SPM is estimated for the whole water column. The length of the timeseries is March – October 2011 and January – July 2012.
Results
It appears that the residual transport per tide is strongly correlated with the wind speed and the wind direction (Figure 1A), in such a way that the northward-southward division lies perpendicular to the axis of the Southern Bight rather than to the local coastline orientation (Figure 1 – right). Southwesterly winds result in higher northward transport (red colours), than the northerly winds generate southward transport (blue colours). The data in Figure 1A does not encompass a full year. We developed a statistical model based on wind direction sectors and wind speed, to calculate the yearly transport for the 10-year wind record 2004-2013. The average SPM transport in the 2.5 km wide TMZ is then 2.75 Mton/yr, with 2010 and 2011 as extremes: 1.75 and 3.25 Mton/yr, respectively.
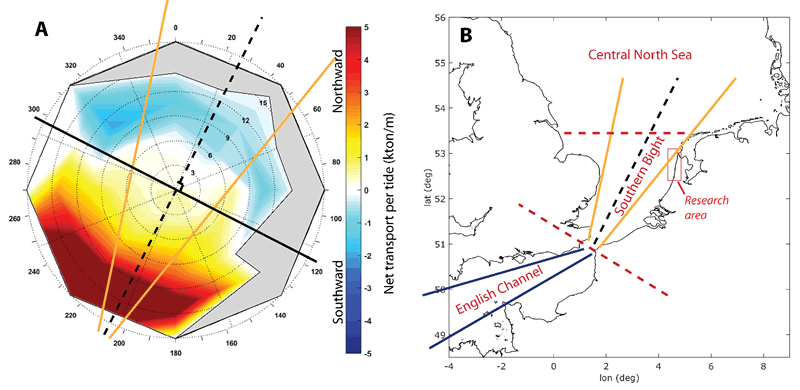
Figure 1. A. Median per wind sector of the net transport per tide (radial distance is wind speed). There is no data for the grey part. On top of the graph the orientation lines from the Southern Bight are sketched. B: Map and sketch of the English Channel – Southern Bight - Central North Sea orientation, along with the research area.
I. Surname1*, F.N. Another-Surname2 , Y. Next-Surname2
1 University Name, Country; 2 Organization Name, Country
* Corresponding author: mail.name@organization.org
