V.M. van Bergeijk1*, J.J. Warmink1, S.J.M.H. Hulscher1
1 University of Twente,
Introduction
High waves during storms can overtop the dike and erode the grass cover resulting in dike failure. Erosion of the cover occurs when the hydraulic load of the overtopping wave exceeds the dike cover strength. High hydraulic loads are caused by three processes: 1) turbulence, 2) high wave front velocities and 3) wave impact at geometric changes in the cross-dike profile. Existing models are only capable of describing the hydraulic load caused by one of these processes. However, a model that accounts for all three processes is required to understand how the hydraulic load varies along the dike profile (Van Bergeijk et al., 2019).
Methods
In this study, a numerical 2DV model is built using the open-source software OpenFOAM® to simulate the flow of an individual overtopping wave over a grass-covered crest and landward slope. Two data sets of overtopping tests on grass-covered dikes in the Netherlands are used to calibrate and validate the model. The model is validated using measured flow velocities and layer thicknesses as function of time. The pressure and stresses are computed in the numerical model to show how the forces on the cover vary along the dike profile and vary over time.
Results and outlook
Figure 1 shows the stresses along the dike profile with a crest width of 2 m and a slope steepness of 1:3. The shear stress τs is highest at the wave front (x =21 m) and decreases over the tail of the wave. This behaviour is similar to the flow velocity and layer thickness, which are also maximum at the wave front.
However, the normal stress is maximum halfway the slope (x =12 m) and is 1/3 of the normal stress at the wave front. Both stresses show the largest variation around their maximum. Next, an in-depth analysis will be performed to study which of the three processes lead to this variation in stresses along the profile. Better understanding of the hydraulic force along the dike profile is required to develop an erosion model that is able to predict failure by all three processes instead of a separate erosion model for each process. In this way, the weakest point along the dike profile can be found to improve the assessment and the design of grass-covered dikes.
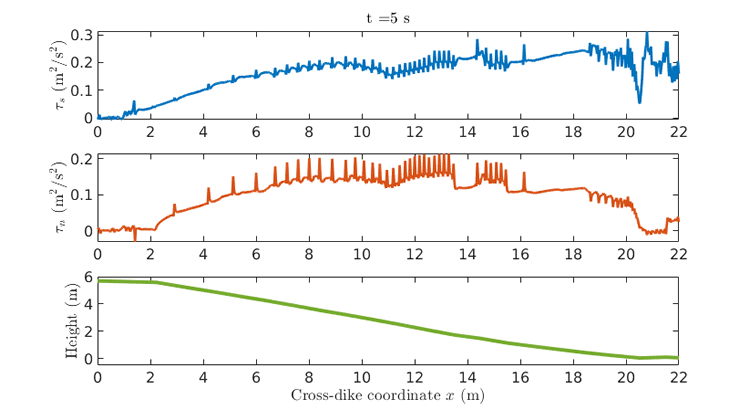
Figure 1 The shear stress τs and tnormal stress τn along the dike profile after 5 seconds of overtopping for an overtopping volume of 2500 l.
Acknowledgements
This work is part of the research programme All-Risk, with project number P15-21, which is (partly) financed by the Netherlands Organisation for Scientific Research (NWO).
References
Van Bergeijk, V., Warmink, J., Frankena, M., & Hulscher, S. (2019). Modelling dike cover erosion by overtopping waves: the effects of transitions. Coastal Structures 2019, 1097-1106.
I. Surname1*, F.N. Another-Surname2 , Y. Next-Surname2
1 University Name, Country; 2 Organization Name, Country
* Corresponding author: mail.name@organization.org
