
B. Biemond1*, H.E. de Swart1, H.A. Dijkstra1 , M. Dìez-Minguito2
1 Utrecht University
2 University of Granada
*corresponding author:
Introduction
Freshwater pulses, during which the freshwater discharge by rivers exceeds three times its long-yearly average value for no longer than one month, are common features in many estuaries around the world. These events cause a strong (temporary) downstream shift of the salt intrusion, having implications for the freshwater availability around the estuary. An important aspect is the recovery time, which is the time it takes for the estuary to reach equilibrium again after the freshwater pulse. Values of this quantity widely vary between observations. For example, Valle-Levinson et al. (2002) found 10 days for the Chesapeake Bay (USA), whilst Gong et al. (2007) reported four months for York River estuary, which is located in the same area. To understand the mechanisms determining this recovery time, an idealised model is employed.
Methods
The idealised model solves the width-averaged subtidal (simplified) equations of motion for an estuary, coupled to the salt balance. This model extends earlier model approaches to estuarine unsteadiness such that it is also capable to handle high river discharge events. A set of simulations is conducted where the idealised case of a freshwater pulse in an estuary is considered. The effect of the background state of the estuary, the peak river discharge and the duration of the pulse on the recovery time is quantified.
Results
The effect of the background state of the estuary expresses itself through the background river discharge. A larger background river discharge leads to a smaller recovery time (Fig. 1). The (somewhat surprising) dependence on tidal strength will also be shown and discussed. The recovery time is insensitive to the peak river discharge and the duration of the pulse. These findings can be explained by studying the different processes driving the recovery.
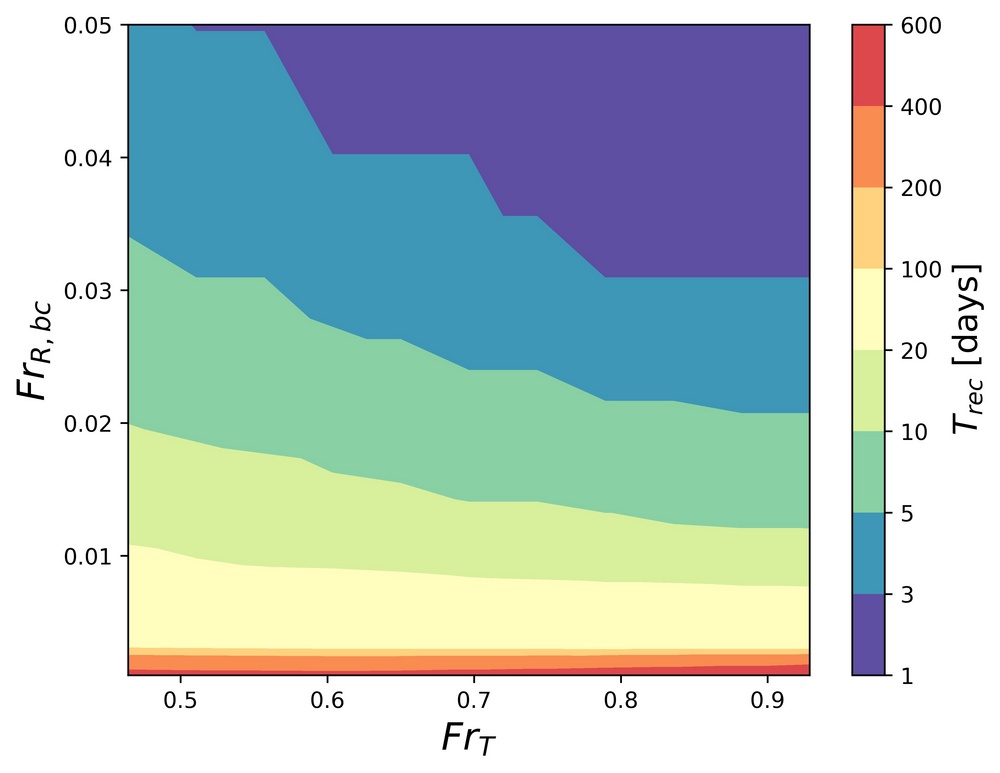 Figure 1: Regime diagram of recovery time Trec versus tidal Froude number (FrT, which is a measure of the strength of the tides) and background freshwater Froude number (FrR,bc, which is a measure of the strength of the river discharge after the pulse).
References
Gong, W., Shen, J., & Reay, W. G. (2007). The hydrodynamic response of the York River estuary to Tropical Cyclone Isabel, 2003. Estuarine, Coastal and Shelf Science, 73 (3), 695-710. https://doi.org/10.1016/j.ecss.2007.03.012
Valle-Levinson, A., Wong, K.-C., & Bosley, K. T. (2002). Response of the lower Chesapeake Bay to forcing from Hurricane Floyd. Continental Shelf Research, 22 (11), 1715-1729. https://doi.org/10.1016/S0278-4343(02)00034-1
I. Surname1*, F.N. Another-Surname2 , Y. Next-Surname2
1 University Name, Country; 2 Organization Name, Country
* Corresponding author: mail.name@organization.org
