
J.M. Fajardo Urbina1*, U. Gräwe2, H.J.H. Clercx1, T. Gerkema3, M. Duran-Matute1
1 Eindhoven University of Technology
2 Leibniz Institute for Baltic Sea Research
3 NIOZ Royal Netherlands Institute for Sea Research;
*corresponding author:
Introduction
In the past, dynamical processes in the Dutch Wadden Sea (DWS) used to be viewed as mainly driven by the tides. Hence, previous Lagrangian studies in the DWS focused on the effects of tides on transport or on the relationship between mean Lagrangian statistics (e.g. the residence time) with ecological parameters. In recent years, it has been recognised that the DWS is strongly affected by the wind, with storms having a disproportionately large impact, as well as a high interannual variability. Therefore, the goal of this research is to link the variability of the Lagrangian transport time scales in the DWS with the wind forcing.
Methods and Results
We employed a 36-year (1980-2015) simulation based on an offline coupling of the General Estuarine Transport Model (GETM) and the Lagrangian model "Parcels". The GETM configuration for the DWS is based on a realistic 3D setup described by Duran-Matute et al. (2014) and Gräwe et al. (2016); while Parcels provides around 300 million trajectories of particles initially released inside the DWS (~ 13 000 particles every 12.42 h for 36 years). For the analysis and due to a strong wind anisotropy, we divided the wind energy into eight sectors (following Gerkema and Duran-Matute, 2017).
During stormy winter (DJF) seasons, which are mainly characterized by intense southwesterly (SW), westerly (W) and sporadic but still energetic southerly (S) wind events, the system is flushed (in terms of the residence time) about two weeks faster than during calm summer (JJA) seasons (Figure 1). An annual cycle is evident with its amplitude largely modulated by the variability of the dominant wind directions (SW, W, S). The lowest values of the residence time occurred during the energetic winters of 1983, 1990, 1995, 2000 and 2007; while the highest ones took place in the summers of 1984 and 1989. We reconstructed the times series of the spatially averaged residence time using an exponential fit with the sum of the energy of the dominant wind directions as predictor. This reconstruction matches the numerical data with a correlation of 0.94 and an error of 1.3 days. Finally, the variability during the winter seasons is explained, to a large degree, by North Atlantic atmospheric patterns.
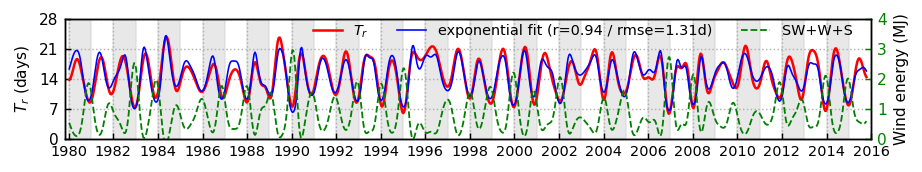
Figure 1: Spatially averaged, low-pass filtered (periods > 0.5 years) residence time and its reconstruction using the wind energy of the dominant wind sectors (W, SW, S) as predictor. The residence time is depicted with red, the reconstruction with blue and the wind energy with green.
References
Duran-Matute, M., Gerkema, T., De Boer, G., Nauw, J., and Gräwe, U. (2014). Residual circulation and freshwater transport in the Dutch Wadden Sea: a numerical modelling study. Ocean Science, 10(4):611–632.
Gräwe, U., Flöser, G., Gerkema, T., Duran-Matute, M., Badewien, T. H., Schulz, E., and Burchard, H. (2016). A numerical model for the entire Wadden Sea: Skill assessment and analysis of hydrodynamics. Journal of Geophysical Research: Oceans, 121(7):5231–5251.
Gerkema, T. and Duran-Matute, M. (2017). Interannual variability of mean sea level and its sensitivity to wind climate in an inter-tidal basin. Earth System Dynamics, 8(4):1223–1235.
I. Surname1*, F.N. Another-Surname2 , Y. Next-Surname2
1 University Name, Country; 2 Organization Name, Country
* Corresponding author: mail.name@organization.org
