J.C.M. Dullaart1*, S. Muis1,2, H. de Moel1, P.J. Ward1, D. Eilander1,2, J.C.J.H. Aerts1,2
1 Institute for Environmental Studies (IVM), Vrije Universiteit Amsterdam
2 Deltares
*corresponding author:
Introduction
Coastal flooding is driven by strong winds and low pressures in tropical and extratropical cyclones that generate a storm surge, and high tides. The combination of storm surge and the astronomical tide is defined as the storm tide. Currently over 600 million people live in coastal areas below 10 m elevation worldwide which is projected to increase to more than 1 billion people by 2050 under all Shared Economic Pathways. Towards the end of the 21st century these growing coastal populations will be increasingly at risk of flooding due to SLR. To gain understanding into the threat imposed by coastal flooding and identify areas that are especially at risk, now and in the future, it is crucial to accurately model coastal inundation and assess the coastal flood hazard.
Method
There are three main types of inundation models with complexity levels ranging from simple, to semi-advanced to advanced. Models capable of simulating inundation at the global scale follow a simple static approach. These models, often referred to as bathtub models, delineate the inundation zone by raising maximum water levels, that correspond to a return period, on a coastal DEM and select all areas that are below the specified water level height. The main limitations of this type of model is that they implicitly assume an infinite flood duration and do not capture relevant physical processes. Regional comparisons have shown that dynamic inundation models are much more accurate than static models in terms of flood extent and depth, and they can provide information on the flood duration.
Results
In this study we develop a global dataset of storm tide hydrographs. These hydrographs represent the typical shape of an extreme sea level event at a certain location along the global coastline (Fig. 1) and can be used as boundary conditions for dynamic inundation models. This way we can move away from static to more advanced dynamic inundation models. To assess how different assumptions used for generating hydrographs influence the inundation extent and depth we perform a sensitivity analysis for several coastal regions.
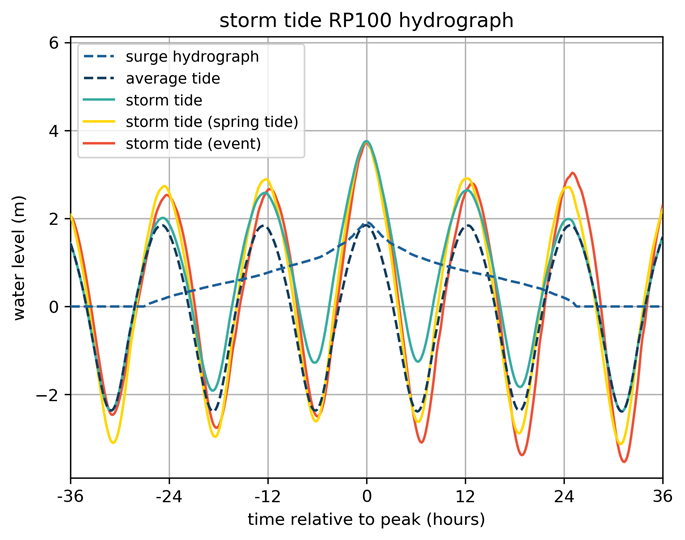
Figure 1: Hydrograph of the 1-in-100 year storm tide event at La Rochelle, France
I. Surname1*, F.N. Another-Surname2 , Y. Next-Surname2
1 University Name, Country; 2 Organization Name, Country
* Corresponding author: mail.name@organization.org
