P.W.J.M. Willemsen1,2,*, B.P. Smits2, B.W. Borsje1, P.M.J. Herman2,3, J.T. Dijkstra2, T.J. Bouma4, S.J.M.H. Hulscher1
1 University of Twente
2 Deltares
3 Delft University of Technology
4 NIOZ & Utrecht University
*corresponding author:
Introduction
Salt marshes can provide coastal protection when included in a Nature-based Flood Defence. The magnitude of the protection by the marsh strongly depends on the lateral extent of the salt marsh, and thereby the potentially dynamic location of the salt marsh edge. This study systematically assesses the influence of daily occurring mild weather conditions including waves and sediment availability on the biophysical development of the salt marsh, and retreat and expansion of the marsh edge.
Methods
50 year dynamics of the salt marsh and marsh edge were simulated by a biogeomorphological model (Willemsen et al., 2022). Parameter settings were derived from salt marshes in the Western Scheldt. Hydrodynamics and morphodynamics were computed by the numerical Delft3D-Flexible Mesh model (D3D-FM) and were coupled with a vegetation growth module, computing the population dynamics balance equation (Temmerman et al., 2007) in Python. D3D-FM and the vegetation growth module were coupled by the Basic Model Interface (Peckham et al., 2013), enabling biophysical interaction. Scenarios were forced without waves, waves of 0.05, 0.10 and 0.15m high with sediment concentrations (SSC) of 10mg/L. Vice versa, other scenarios were forced with SSC of 10, 25 and 50mg/L with waves of 0.10m.
Results & conclusions
Both simulated patterns and variability at the marsh edge resembled field observations. The marsh edge expanded at low wave forcing (0.00m; 0.05m) and retreated at higher wave forcing (0.10m; 0.15m) (Fig. 1). With higher wave forcing the marsh edge was found at lower elevations, indicating an unhealthy system due to vegetation mortality, suggesting the importance of response time of vegetation to physical stress. Still the salt marsh with higher wave forcing was able to expand with increasing sediment supply.
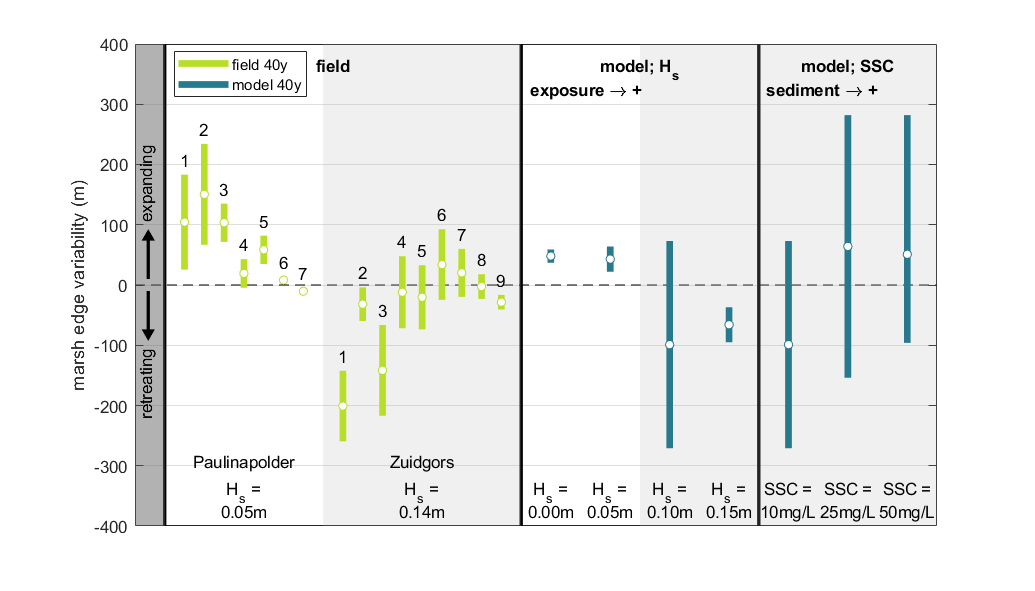
Figure 1: Variability of the marsh edge, i.e. mean location (white marker) and standard deviation (bar); from field data in the period 1975-2015 and from simulations. Transect numbers are showed above the bars. Simulations with an SSC of 10mg/L are sorted with an increasing wave exposure; simulations with a wave height of 0.10m are sorted with an increasing sediment availability.
References
Peckham, S. D., Hutton, E. W. H. and Norris, B. (2013). "A component-based approach to integrated modeling in the geosciences: The design of CSDMS." Comput Geosci 53: 3-12.
Temmerman, S., Bouma, T. J., Van de Koppel, J., Van der Wal, D., De Vries, M. B. and Herman, P. M. J. (2007). "Vegetation causes channel erosion in a tidal landscape." Geology 35(7): 631-634
Willemsen, P. W. J. M., Smits, B. P., Borsje, B. W., Herman, P. M. J., Dijkstra, J. T., Bouma, T. J., & Hulscher, S. J. M. H. (2022). Modeling decadal salt marsh development: Variability of the salt marsh edge under influence of waves and sediment availability. WRR, 58, e2020WR028962.
I. Surname1*, F.N. Another-Surname2 , Y. Next-Surname2
1 University Name, Country; 2 Organization Name, Country
* Corresponding author: mail.name@organization.org
