W. Dabekaussen1, J.C. Stam1, M.A.J. Bakker1, S. van Heteren1
1 TNO – Geological Survey of the Netherlands
*corresponding author:
Introduction
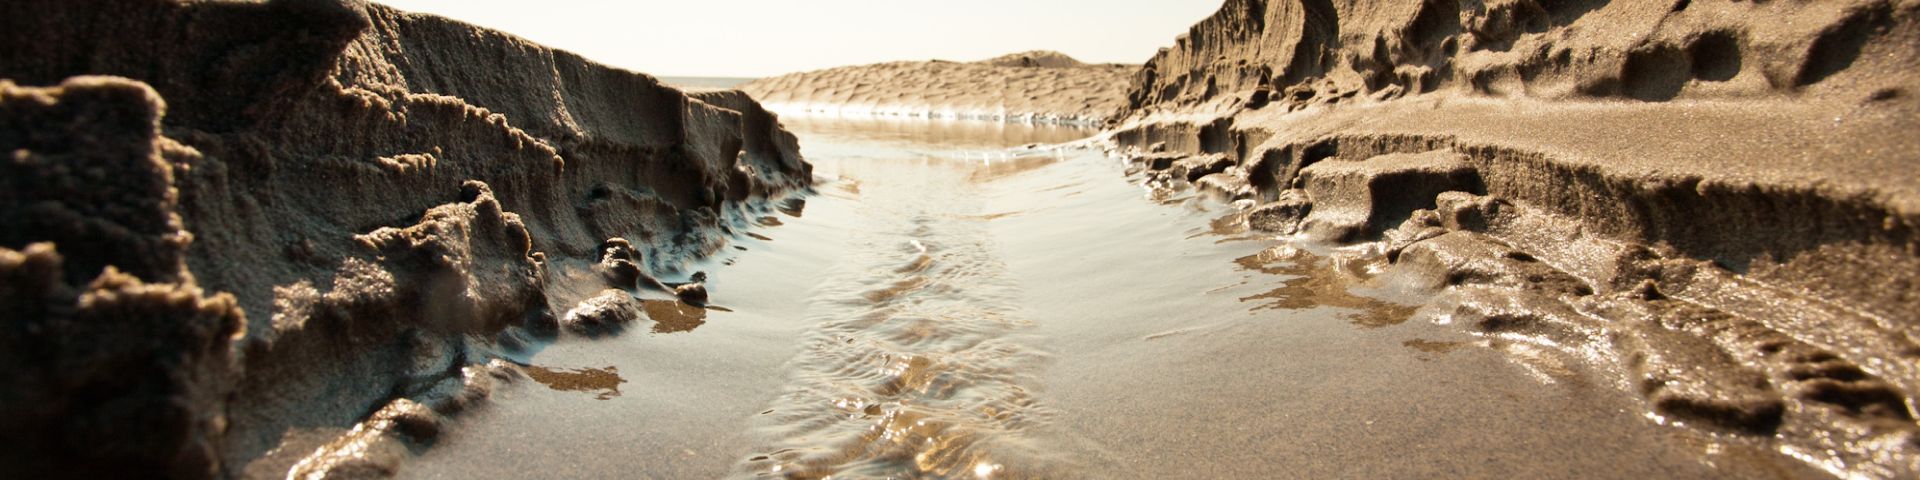
The bed of the North Sea plays an important role as a habitat for animals and plants, and many human interventions take place on and in it. It is important to visualize this dynamic environment as accurately as possible. The old hand-drawn map, in use for more than 20 years, has been replaced by a grid model, calculated with machine learning.
Methods
The random forest algorithm, a machine-learning technique that makes regular updates of the maps feasible and affordable, was used to automate the interpolation of point data from sample locations to full-coverage maps. On the basis of visual sediment descriptions, grain-size analyses and bathymetry-derived positional attributes, the most likely sediment type and associated uncertainty were predicted for 100 by 100 meter grid cells. Statistical analysis has been used to quantify the best combination of input variables and interpolation settings.
Results
The new seabed-sediment maps show which sediment class typifies the top half meter of the seabed. The user can choose between three classification systems based on the ratio of mud (< 63 µm), sand (63-2000 µm) and gravel (> 2000 µm): the international Folk standard, a simplified version of this standard for a single-image overview of the entire Dutch North Sea bed, and a further simplification consistent with the European Union Nature Information System (EUNIS). For each map, the probability of the predicted class is visualized as well. This attribute is important when a map view is used to make decisions. Users will need some time getting used to the new views. The simple, flowing pattern of the old, hand-drawn map has been replaced by a higher-resolution but speckly representation in which areas with a particular sediment type can be very small. Once users are accustomed to this visual change, a brand-new generation of seabed-sediment maps can be applied to its full capability. The grid format makes integration of seabed-sediment data into decision-support systems easier than before. Public data provided by users and other stakeholders will be incorporated into these maps once a year.
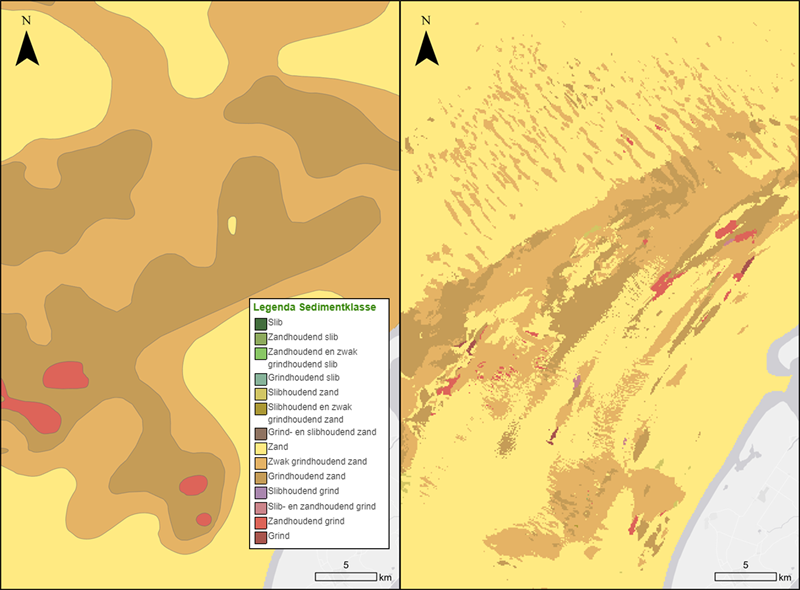
Figure 1: Old and new map views for an area northwest of Texel island.
References
Dabekaussen, W., Stam, J., Bakker, M.A.J. & Van Heteren, S. (2022). Seabed-sediment map for the Dutch continental shelf. Scale 1:200,000. Geological Survey of the Netherlands, www.dinoloket.nl/en/subsurface-models.
I. Surname1*, F.N. Another-Surname2 , Y. Next-Surname2
1 University Name, Country; 2 Organization Name, Country
* Corresponding author: mail.name@organization.org
