Niels C. van Kouwena*; Anne M. Tona; Sander E. Vosa; Thomas Vijverbergb; Ad J.H.M. Reniersa; Stefan G.J. Aarninkhofa
a Delft University of Technology, Civil Engineering and Geosciences; b Boskalis Nederland
*Corresponding Author
Many sand spits are morphodynamically complex cases, that are either analysed with complex and expensive computational models or at a conceptual level. Therefore, most case studies on spits in different types of environments are descriptive. A novel method was devised to analyse morphodynamic data of spits at a quantitative level in a non-tidal, wind-dominated lake environment, at the Marker Wadden islands in lake Markermeer, the Netherlands. Sedimentation was quantified around both spits in the horizontal plane using polar coordinates and in the vertical through morphologically simplified elevation levels. It was found that, sediment transporting currents that pass over the spit-platform into deeper waters, drive spit-platform growth in that direction. The spit-platform growth in turn dictates the growth of the emerged spit. Spit growth quantification enables a detailed understanding of the Marker Wadden spits, which gives insights in spit behaviour in low-energy lake environments. At the Marker Wadden the submerged spit-platform grows during high energy wind conditions (Figure 1) while the emerged spit part grows under significantly lower energy conditions. Spit growth is a build-up of different morphodynamic processes all of which relate back to the loss of transport capacity around the spit. With this method we can quantitatively investigate the role of these morphodynamic processes, not only on a conceptual level, but also for a specific spit.
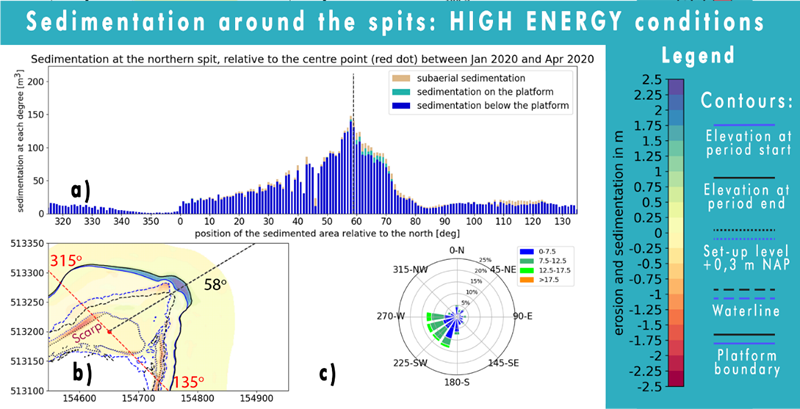
Figure 1: Examples of sedimentation patterns during high-energy periods at the northern spit of the Marker Wadden. a) Each bar gives the sedimentation that occurred in the period on that particular direction. In the bar graphs the grey lines indicate the centre of mass of a distinguishable deposition. The difference in the elevation of sedimentation locations can be seen by the size difference between the sub-platform level (blue) and the platform level (turquoise). b) A visual representation of the location of sedimentation (blue) and erosion (red). c) The wind rose gives the wind conditions during the period.
References
van Kouwen, N. C., Ton, A. M., Vos, S. E., Vijverberg, T., Reniers, A. J. H. M., Aarninkhof S. G. J. (2022), Quantifying complex relations between spit growth and its hydrodynamic drivers, in non-tidal, wind-dominated lake environments. Application to the Marker Wadden (Lake Markermeer, The Netherlands), under review at Geomorphology
I. Surname1*, F.N. Another-Surname2 , Y. Next-Surname2
1 University Name, Country; 2 Organization Name, Country
* Corresponding author: mail.name@organization.org
