
Johan van de Koppel1,2, Loreta Cornacchia1,3, Dulci Steijvers2, Abigail Schiller1, Jacco de Kok1, en Daphne van der Wal1,4.
1 Royal Netherlands Institute for Sea Research (NIOZ), Department of Estuarine and Delta Systems, Yerseke, Netherlands; 2 Groningen Institute for Evolutionary Life Sciences, University of Groningen, Groningen, The Netherlands; 3 Department of Water Engineering and Management, University of Twente, Enschede, The Netherlands; 4 Faculty of Geo-Information Science and Earth Observation (ITC), University of Twente, Enschede, The Netherlands;
* Corresponding author:
Introduction
Managed-realignment, e.g. the de-embankment of polder areas, is an important tool for coastal managers to create climate-resilient coastlines. Managed realignment, however, remains a challenging goal, for two reasons. First, the wetland needs to be designed in such a way that the target ecosystem can efficiently develop. Second, stakeholders and the general public need to be convinced that realignment will lead to a valuable ecosystem.
Methods
Using remote sensing data, we studied managed realignment projects in the Netherlands and in the UK to investigate the success of de-embankments in facilitating ecosystem establishment. From this, we developed and implemented a model to predict wetland development in a future managed realignment project in the Biesbosch, to study the implications of more natural or more controlled designs. Using a pipeline from biogeomoprhological model to a 3D Computer graphics system, we develop a visually tangible representation of how the area will look in 15 years time (Fig 1.).
Results
Our survey and model analysis highlighted that restored marshes are less resilient than their natural counterparts: model simulations with and without an imposed initial creek system showed that self-organized creeks had higher sediment transport efficiency than dug-out creeks, especially when the artificial creeks deviated more from a natural creek pattern. Finally, we present depictions of the predicted de-embanked landscape, that will be integrated in an on-site visualization system to explain the project development to a general audience.
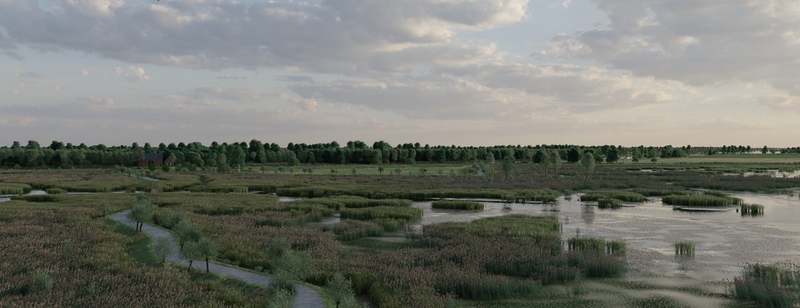
Fig 1. A 3D visualization of a modelled future de-embankment in the Biesbosch.
I. Surname1*, F.N. Another-Surname2 , Y. Next-Surname2
1 University Name, Country; 2 Organization Name, Country
* Corresponding author: mail.name@organization.org
