
J.H. Damveld1*, B.W. Borsje1 , S.J.M.H. Hulscher1
1 University of Twente, Netherlands
* Corresponding author: j.h.damveld@utwente.nl
Introduction
The seabed of coastal shelf seas, such as the North Sea, consist of various rhythmic bed patterns (van der Meijden et al, 2023). Sand banks, oriented parallel to the main tidal current, have spacings of kilometres and heights of tens of metres. Sand waves, oriented perpendicular to the tidal current, are smaller with spacings of hundreds of meters and heights up to 10 metres. In particular these sand waves are relevant for offshore engineering as, on average, they migrate several metres per year, thereby exposing cables/pipelines and other objects on the seafloor. It is therefore essential to understand their dynamic behaviour in order to realistically predict the dimensions and migration rates of sand waves.
The migration of sand waves is commonly determined by measuring the crest displacement taken from seabed surveys. However, as these surveys generally have intervals of several years, migration due to short-term effects is not captured in the data. In the scarcely available data that have a high temporal resolution (e.g. van Dijk et al, 2005), striking nonlinear effects (negative migration, shape changes, flattening) are observed after storms.
Objective and Methods
Given the relevance for engineering and the limited knowledge on wind-driven migration of sand waves, there is a need for new seabed datasets with a high spatial and temporal resolution. Recently, the Dutch Hydrographic Service, responsible for seafloor measurements, have surveyed a shipping lane in the North Sea (see figure). As the entire area was surveyed over a period of almost one year, adjacent survey tracks are recorded with intervals of days to weeks. Because the survey tracks are required to partly overlap in order to get full spatial coverage, episodical sand wave migration can be detected from these overlapping areas. In combination with a high spatial data resolution of 1 m, this creates a unique dataset.
First, a lowpass filter is applied to the raw data to separate the superimposed megaripples from the sand waves. Then, using cross-correlation the migration in the direction of the transect was determined. The resulting migration rates per survey interval were subsequently compared to the wave climate on the North Sea, quantified through the Shields parameter.
Results
Analysis of the results show relatively low sand wave migration within the relatively short survey windows. For the longest survey window, extrapolated to yearly rates, migration of a few meters per year in north-eastern direction are recorded. This corresponds to historical long-term surveys in that same area. When focussing on shorter time intervals, consistent migration rates are not present. However, sand wave shapes are clearly affected during period of increased wave energy. Sand waves tend to be lower in some locations, in particular the crests. Also, the secondary bed forms (ripples and megaripples) are affected, being lower and longer than during calm conditions.
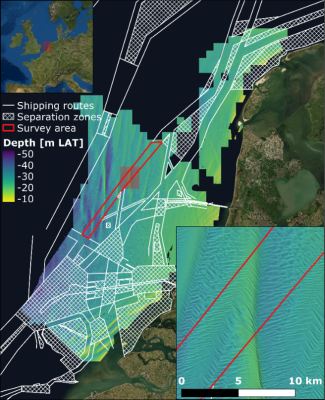
Bathymetry of the Netherlands Continental Shelf. Data from the Dutch Royal Navy.
References
van Dijk, T. A. G. P., & Kleinhans, M. G. (2005). Processes controlling the dynamics of compound sand waves in the North Sea, Netherlands. Journal of Geophysical Research: Earth Surface. doi:10.1029/2004JF000173
van der Meijden, R., Damveld, J. H., Ecclestone, D. W., Van der Werf, J. J., & Roos, P. C. (2023). Shelf-wide analyses of sand wave migration using GIS: A case study on the Netherlands Continental Shelf. Geomorphology, 424, 108559. doi:10.1016/j.geomorph.2022.108559
