Ashraf A. Almohagrya*, Tom O’Mahoneyb, Fateme Ebrahimi Eramia, Vasileios Kitsikoudisa, Suzanne J. M. H. Hulschera
a Department of Water Engineering and Management, University of Twente, Enschede, The Netherlands; b Hydraulic Engineering, Deltares, Delft, The Netherlands
* Corresponding author: ashraf.almohagry@gmail.com
Introduction
Saltwater intrusion is a significant challenge in semi-enclosed estuaries, such as the Haringvliet. The Haringvliet is a large inlet of the North Sea that was closed in 1970 as part of the Delta Works in the Netherlands (Kranenburg et al., 2023). Saltwater intrusion leads to the formation of saline pools in scour holes within the estuary. Mitigating saltwater intrusion involves the determination of the freshwater discharge during ebb tide that is needed to flush out the saltwater that has entered the system during flood tide. In the Haringvliet, the biggest challenge is to determine the minimum discharge that is needed to effectively flush out the saltwater from the scour holes. The urgency for precise freshwater management strategies has increased because of the anticipated freshwater scarcity due to climate change. Despite existing studies on flushing saltwater from cavities, there is a knowledge gap in quantifying the saltwater entrainment rate from real-life scour holes. This study addresses this knowledge gap by studying the saltwater entrainment rate from a real-life scour hole using Computational Fluid Dynamics (CFD) models validated against both lab-scale and field-scale flows.
Objective and Methods
This research aimed to accurately predict the saltwater entrainment rate from a scour hole in the Haringvliet. Using Star CCM+ software, a model was developed consisting of a cavity, initially filled with saltwater, with a flow of freshwater above it entraining saltwater and causing the freshwater-saltwater interface to drop over time. The methodology involved creating 2D models based on the Reynolds-Averaged Navier-Stokes approach and 3D models employing the Detached Eddy Simulation (DES) approach. The model performance in predicting the saltwater entrainment rates was validated against the laboratory results of Debler and Armfield (1997). The best-performing lab model was then scaled up to match the parameters and geometry of a scour hole in the Haringvliet. The performance of this field-scale model was further validated using field data from a large flushing event on the 17th of February 2023, including measurements from Acoustic Doppler Current Profilers (ADCPs). The ADCP data were utilized to locate the points of maximum velocity gradient across each vertical profile, as seen in Figure 1a. Averaging these points allowed for obtaining the freshwater-saltwater interface height, as shown in Figure 1b, which was then used to evaluate the model's performance in predicting the temporal variations of the freshwater-saltwater interface.
Results
The sensitivity analysis showed that the Star CCM+ software performed relatively better in predicting the saltwater entrainment in the Haringvliet model compared to the lab-scale models. In contrast to the Haringvliet model, the lab-scale model displayed strong turbulence and notable vortex formations resulting in overpredictions of the entrainment rate. The DES-modeled drop of the freshwater-saltwater interface in the Haringvliet scour hole, compared with the drop from the field observations, yielded small RMSE values ranging between 0.40 and 0.82 m, indicating good model performance. In addition, the modelled pycnocline's inclination matched the one observed from the ADCPs data, where the saltwater level at the downstream part of the scour hole was higher than the saltwater level at its upstream part. Overall, the Haringvliet CFD model predicted well the temporal changes in the freshwater-saltwater interface height and the inclination of the pycnocline over the simulated period.
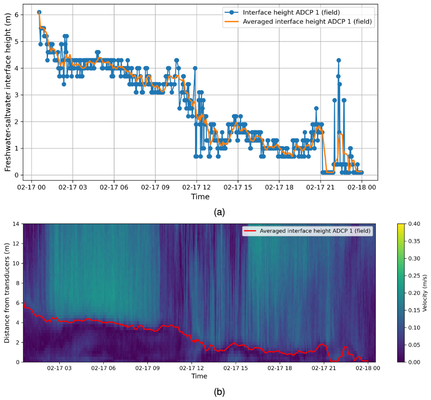
Figure 1. (a) Averaged freshwater-saltwater interface height estimated from the velocity profiles; (b) Estimated freshwater-saltwater interface height overlaid on field velocity measurements.
References
Debler,W., & Armfield, S.W. (1997). The purging of saline water from rectangular and trapezoidal cavities by an overflow of turbulent sweet water. Journal of Hydraulic Research, 35(1), 43–62. https://doi.org/10.1080/00221689709498643
Kranenburg, W. M., Tiessen, M. C., Blaas, M., & Van Veen, N. P. (2023). Circulation, stratification and salt dispersion in a former estuary after reintroducing seawater inflow. Estuarine, Coastal and Shelf Science, 282, 108221. https://doi.org/10.1016/j.ecss.2023.108221
