L.W.M. Roest1,2*, P. Rauwoens1
1 KU Leuven, Belgium; 2 IMDC, Belgium
* Corresponding author: bart.roest@kuleuven.be
Introduction
Sandy coasts exhibit a continuous morphological evolution under external forcing due to wind, waves, tidal currents and human interference. It is generally accepted in geomorphology that features closer together show more similarities than those far apart. Likewise, beach profiles close together are subject to similar external forcings and therefore expected to show similar morphological behaviour.
The Belgian coast is surveyed at least every year, and has been for the past 30 to 40 years, depending on the location. The morphological evolution is reported in terms of sediment volume changes per coastal section (ca. 250 m alongshore, 1500 m cross-shore). In previous reports similar-looking sections have been pragmatically grouped together. However, it appears that the morphological development in different parts of the coastal profile may (or may not) show contrasting trends, i.e. the beach may be accreting, while the shoreface is eroding and vice-versa. Here we determine zones of coherent morphological behaviour in different parts of the coastal profile and the length-scales involved.
Objective and Methods
Morphological behaviour of the Belgian coast is assessed via timeseries of sediment volume changes per coastal section (about 250 m alongshore), spanning 30 to 40 years. These volume changes are derived for several horizontal layers over the profile, named: dune foot, dry beach, intertidal beach, shoreface and seabed. These layers are subject to different (combinations of) forcing mechanisms, thus differences in morphological behaviour between layers in the same section may be expected.
Linear (Pearson) correlations between individual pairs of volume timeseries are made, resulting in a correlation matrix of correlation coefficients (rij) for each layer. Positive correlations indicate similar trends, while negative correlations indicate opposing trends. Length-scales are derived from ‘blocks’ of high correlation (r>0.7), adding-up the respective alongshore section lengths.
Since the dry beach and dune foot are frequently nourished along large portions of the coast for coastal safety and recreational purposes, the sediment volume in these layers has generally increased there over the past decades. Corrections for nourished volumes are the subject of further research.
Results
Correlations are found both locally, as well as remotely. Locally coherent blocks of high correlation exist, yet similar behaviour is also found elsewhere along the coast limiting the number of behaviour classes. It was also found that correlations found in one layer do not automatically imply correlations in other layers over the same areas.
Correlations on the dry beach and dune foot layers are generally high and most sections are (weakly) positively correlated to each other with few exceptions (Figure 1, above diagonal). Lengths of coherent behaviour vary along the coast. In the west, two blocks of 4.5 and 5.5 km are present, while in the central area separation is less clear forming a block of about 15 km west of Oostende, and 4 to 6 km blocks to the east. East of Zeebrugge, coherent blocks are small with alternating blocks between 1 and 3.5 km.
The shoreface (Figure 1, below diagonal) shows more contrasting behaviour, with several clearly separated coherent blocks of 1 to 2.5 km at the west coast, 4.7 km at Oostende, 3.7 and 3.2 km west and east of Zeebrugge harbour. The rest of the coast apparently shows more gradual differences in behaviour with no clear separation between adjacent sections, yet diminishing correlations over distances larger than 3km. Examples of opposing trends are the continuous accretion west and east of Zeebrugge harbour, while the shoreface is eroding along the Appelzak (km 58-63) and Potje (km 1-4) tidal channels (Figure 1, below diagonal).
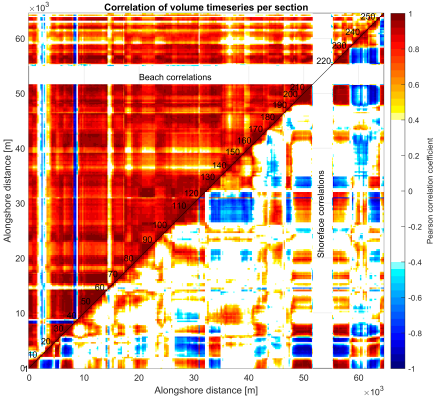
Figure 1: Correlation matrix generated by correlating volume timeseries of individual pairs of coastal sections along the Belgian coast. Positive correlations (warm colours) indicate similar coastal behaviour, negative correlations (cold colours) indicate opposing behaviour. Above the diagonal: correlation coefficients of beach and dune foot volume changes. Below the diagonal: correlation coefficients of shoreface volume changes. Section numbers are indicated on the diagonal.
