L. van Gijzen1,2*, P.M.J. Herman1,2, M. van der Wegen 1,3 , B.C. van Prooijen2, S.G. Pearson1,2
1 Deltares, 2 Delft University of Technology, 3 UNESCO-IHE
Introduction
San Francisco Bay is one of the largest estuaries of the US Pacific Coast with an area of 4000 km2. It consists of two hydrologically disti
nctive sub-embayments North Bay and South Bay. South Bay is unique as it does not experience the freshwater flushing typical for estuaries. It experiences the largest freshwater input during a regime of reverse estuarine circulation during Winter, when the entire Bay becomes fresher following peak discharges from the northern rivers. Hence both saline and freshwater enter from Central Bay through the same entrance. South Bay is dealing with increased risk of inundation due to the combination of sea level rise and land subsidence and a deteriorating water quality.
Understanding sediment pathways within South Bay and sediment exchange at its entrance can support the development of management strategies dealing with turbidity depended algae blooms and the development of salt marshes as a measure against sea level rise. Additionally, by understanding the current factors controlling fine sediment dynamics, future implications of climate change can be better predicted. Though San Francisco Bay is the topic of much research, a process-based model with a model domain covering the entire Bay is a novel approach to analyse fine sediment dynamics in South Bay.
Methods
A Delft3D-DELWAQ buffer layer model was calibrated against a newly available combination of local high-frequency suspended sediment concentration (SSC) measurements and two-monthly, depth varying SSC measurements across the entire 145 km length of the Bay. Subsequently the method of Sediment Connectivity was applied to analyse sediment pathways and net sediment fluxes in South Bay. Sediment Connectivity is an approach that uses network analysis to quantify sediment fluxes based on a schematization of San Francisco Bay into 17 segments. Large data sets of spatial and temporal output were reduced to a 17x17 adjacency matrix permitting a more straightforward analysis and the application of different statistical metrics unavailable in more traditional approaches.
Results and implications
Calibration enabled the model to better capture seasonal and episodic variations in SSCs across the Bay. Connectivity analysis uniquely revealed key dominant pathways, which agree well with literature. Additionally, it unveiled intra-basin transport pathways, regions of erosion and sedimentation and an indication of the varying controlling forcings during the year. Finally, this study acts as a proof of concept for the Sediment Connectivity method that could be applied in other estuaries.
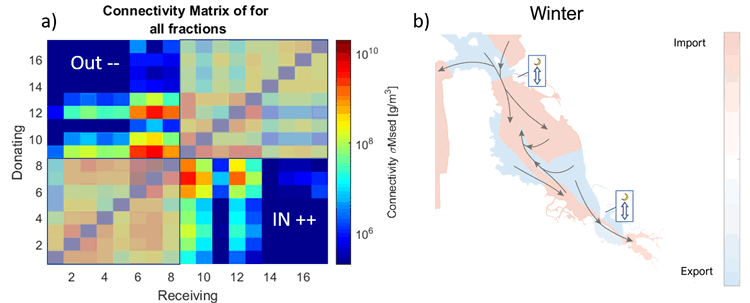
Figure 1 a) Connectivity Matrix for SFB in Spring indicating the incoming fluxes and outgoing fluxes with respect to South Bay during Winter (dec-feb). Each row represents outgoing fluxes from a certain segment and each column incoming fluxes. b) Concept Diagram with a schematization of the sediment fluxes, regions of import and export in Winter, with the tide being dominant in the sediment exchange at the South Bay entrance.
I. Surname1*, F.N. Another-Surname2 , Y. Next-Surname2
1 University Name, Country; 2 Organization Name, Country
* Corresponding author: mail.name@organization.org
