A.M. Ton1*, V. Vuik1,2, S.G.J. Aarninkhof1
1*TU Delft,
Introduction
The morphodynamics of sandy foreshores or beaches in lakes, classified as low-energy, non-tidal environments, have not been studied as extensively as open coasts. Low-energy or sheltered beaches are expected to undergo little transformation, therefore little research focusses on this type of shores (Nordstrom & Jackson, 2012). The goal of this research is to analyse the morphology and hydrodynamic steering of sandy non-tidal, low-energy beaches and its development over time.
Methods
Four unique study sites in the Markermeer give us the opportunity to study low-energy, non-tidal sandy beaches. The morphology of the Pilot Houtribdijk (a pilot study into dike reinforcement by sandy foreshores at the Houtribdijk) and three study sites at the Marker Wadden look very similar to results from laboratory studies with constant waves on an initially plane slope. With these lab experiments, Hallermeier (1980) validated his definition of depth of closure (DoC). We analysed the analogy between the laboratory study and our field sites and the meaning of DoC on low-energy beaches. Moreover, the morphological development is quantified by studying volumes in three vertical zones (figure ) over time and linking changes to hydrodynamics (figure).
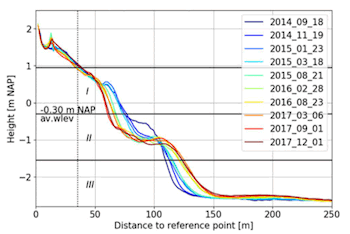
Figure 1 Morphological development Pilot Houtribdijk; I: beach face, II: platform, III: offshore zone
Results and Conclusions
Literature research shows that low-energy sandy beaches generally have a narrow beach face and a low gradient terrace or platform (Nordstrom & Jackson, 2012), which we also see at the four study sites. The platform at Pilot Houtribdijk (figure 1) develops at the depth where wave-induced sediment transport is close to zero, the DoC (figure ). The volume in the beach face (zone I) decreases over time for all sites, while the platform (zone II) and the offshore zone (zone III) grow. Sediment transport is mostly cross-shore and the morphological development is erosion-driven. These new findings will facilitate evidence-based design of future nature-based solutions to ensure safety against flooding in non-tidal, low-energy environments.
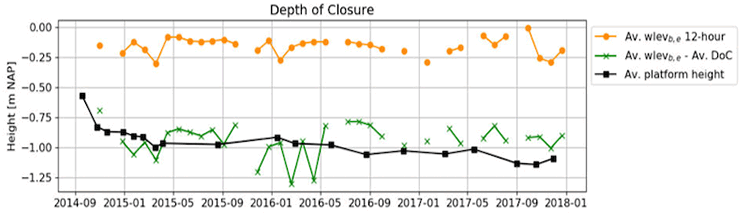
Figure 2 Average (av.) depth of closure w.r.t. average water level before and after storm compared to platform height
References
Hallermeier, R. J. (1980). A profile zonation for seasonal sand beaches from wave climate. Coastal Engineering, 4(C), 253–277. https://doi.org/10.1016/0378-3839(80)90022-8
Nordstrom, K. F., & Jackson, N. L. (2012). Physical processes and landforms on beaches in short fetch environments in estuaries, small lakes and reservoirs: A review. Earth-Science Reviews, 111(1–2), 232–247. https://doi.org/10.1016/j.earscirev.2011.12.004
I. Surname1*, F.N. Another-Surname2 , Y. Next-Surname2
1 University Name, Country; 2 Organization Name, Country
* Corresponding author: mail.name@organization.org
