
S.M. Haverkate* and T.D. Price
Utrecht University,
Introduction
To combat ongoing coastal erosion, in 1990 the Dutch government decided to maintain the volume of sand in the coastal zone by means of nourishments. Nourishments have previously been found to reduce natural dynamics by, among other things, halting autonomous net offshore sandbar migration. Shoreface nourishments, where sand is deposited against the seaward-most sandbar, increase the volume of the outer bar and affect the dynamics of the more landward-located sandbars. Although this is thought to lead to onshore bar migration and a corresponding onshore sediment flux, the process through which shoreface nourishments lead to onshore sediment transport remains largely unknown. The aim of this research is to determine the effect of the long-term nourishing of sand on sandbar characteristics and dynamics, and the corresponding sediment fluxes.
Methods
This study focusses on an 11-km stretch of coast, around the town of Egmond aan Zee, the Netherlands. Approximately the northern half of this study area was regularly nourished after 1990, whereas the southern half remains unnourished to date (Figure 1). This allows for a direct comparison between the two adjacent areas in the period before and after the nourishment policy was implemented. To do so, we used 50 years (1963-2013) of cross-shore profiles (JARKUS data) that were measured yearly with an alongshore spacing of 250 m in the study area. To isolate the bars from the profiles, we developed methods to determine a range of geometric properties, including mean slope in the active bar zone, the landward and seaward bar edge, the center of mass, and the volume of each bar.
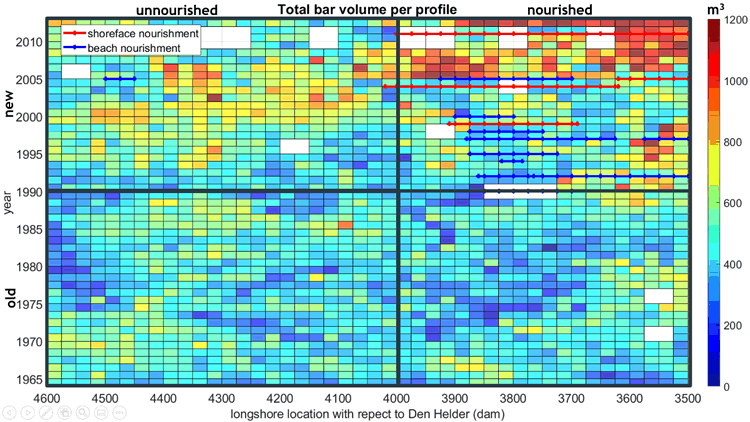
Figure 1Timestacks of total bar volume (colors indicate m3/ longshore m) per transect (x-axis; left-right corresponds to south-north) between the years (y-axis; from bottom to top).
Results
A total number of 6796 bars were found in the transects and made it possible to investigate the role of sand nourishments on sandbar dynamics. As illustrated in Figure 1, the total bar volume increased both in the nourished and the unnourished sections after 1990. Moreover, in the last 8 years, the bars in the nourished section obtained the largest total volumes of the entire dataset.
I. Surname1*, F.N. Another-Surname2 , Y. Next-Surname2
1 University Name, Country; 2 Organization Name, Country
* Corresponding author: mail.name@organization.org
