Ype Attema1*, Bas van Leeuwen1
1 Svašek Hydraulics,
Introduction
Rijkswaterstaat is planning to construct wind turbines on the soft (and the hard) sea defense of Maasvlakte 2. This will aid the organization in becoming climate neutral by 2030. Rijkswaterstaat has asked Svašek to explore the morphological implications of wind turbines on the beach and in the surf zone. One of the concerns is the effect of such hard objects on the sustainability of the sandy sea defense.
Applying XBeach on year-round conditions
XBeach has been applied to simulate two years of morphological development. A curvilinear grid is used with cells measuring 5x35 m (cross- x longshore) in the area of interest. The model has been set-up via an automated succession of stationary (for mild conditions, Hm0≤1.50m) and surfbeat (for more significant waves, Hm0>1.50m) simulations. These simulations constitute a 15 part representative wave climate. Each simulation has its own morphological acceleration factor (ranging from 1.38 to more than 50) and is defined via a fixed amount of hydrodynamic time per simulation (25 hours).
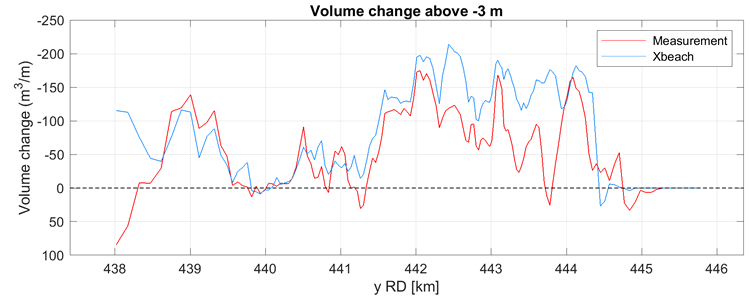
Figure 1 Calibration result against 2017-2018 measured coastal development.
The model has been calibrated against 2017 and 2018 surveys (without nourishment) commissioned by the Maasvlakte 2 project organisation (PUMA). Overall calibration of the model (factor of 0.3) and the cross-shore calibration factor (facua = 0.10) proved most important. The calibration result is given in Figure 1. Please note that the complex southern end of Maasvlakte 2 (y-RD<438.5 km) and its interaction with the Haringvliet entrance is not incorporated in the model. Overall the simulated development matches the measured development very well.
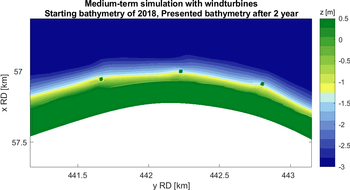
Figure 2 Simulation with wind turbines, final bed lay out.
Application: wind turbines in and above the surf zone
The model has been applied to a situation with ten circular objects (diameter 20 m) in and above the surfzone. Local grid refinements have been applied around the wind turbine location. Final results in Figure 2 show the clear development of salients and local protection of the coast.
I. Surname1*, F.N. Another-Surname2 , Y. Next-Surname2
1 University Name, Country; 2 Organization Name, Country
* Corresponding author: mail.name@organization.org
