C.O. van IJzendoorn1*, S. de Vries, C. Hallin1 2
1 TU Delft,
2 Lund University
Introduction
The decadal development of coastal dunes is a result of the interplay between marine and aeolian processes. To date, it is unclear how this development is governed by short-term processes like storms and long term processes like sea level rise. Previous researches, have studied the decadal dune behavior by looking at specific geomorphological parameters. For instance, Ruessink and Jeuken (2002) used the cross-shore dune foot location and De Vries et al. (2012) used dune volume and beach slope. Here, we identify decadal trends in profile shape along the Dutch coast with an emphasis on the elevation of the dune toe. This parameter is expected to increase in elevation with sea level rise.
 Methods
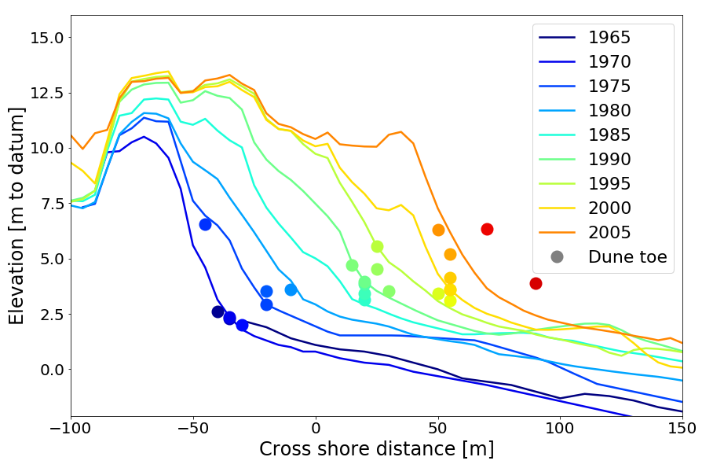
The extensive Jarkus database contains 200-250 m spaced profiles that have been measured yearly since 1965. Diamantidou et al. (2020) extracted the dune toe from this dataset using the second derivative method. These dune toes were filtered and analysed to study the decadal development. Figure 1 shows an example of the dune toe development in a coastal profile.
Figure 1: The development of the dune toe in a coastal profile from the JarKus dataset.
 Results and discussion
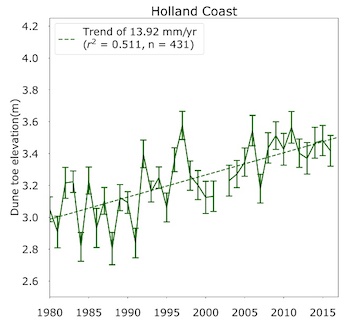
The analysis of the dune toes results in the identification of several long term trends. It is found that the dune toe along the Holland coast increases linearly by 14 mm per year (Figure 2), and moves ±1.3 m seaward per year. A vertical translation of the coastal profile with sea level rise can be expected based on traditional concepts (e.g. by Bruun). However, the derived dune toe elevation increase is much larger rise than expected based on past sea level rise, which was only 1.9 mm/yr. Governing processes for this averaged behaviour remain unclear. A more detailed analysis of specific locations (e.g. nourished areas) might unravel specific governing processes.
Figure 2: Dune foot and crest elevation through time.
References
Ruessink, B.G., Jeuken, M.C.J.L. (2002). Dunefoot dynamics along the Dutch coast. Earth Surface Processes and Landforms 27 (10), pp. 1043-1056.
De Vries, Southgate, Kanning, Ranasinghe (2012). Dune behaviour and aeolian transport on decadal timescales, Coastal engineering, 67, pp. 41-53.|
Diamantidou, E., Santinelli, G., Giardino, A., Stronkhorst, J., & de Vries, S. (2020). An Automatic Procedure for Dune Foot Position Detection: Application to the Dutch Coast. Journal of Coastal Research, 36(3), 668-675.
I. Surname1*, F.N. Another-Surname2 , Y. Next-Surname2
1 University Name, Country; 2 Organization Name, Country
* Corresponding author: mail.name@organization.org
