T. Kettler1*, M.A. de Schipper1, A.P. Luijendijk1,2, S.G.J. Aarninkhof1
1 Delft University of Technology,
2 Deltares
Introduction
Current coastal protection strategies in the Netherlands aim to maintain the coastline by the application of sand nourishment in various forms. Uncertainties in the rate and magnitude of sea level rise, as well as the desire to involve multiple coastal functions in future coastal protection strategies have risen the demand for the exploration of nourishment solutions that fit a larger geographical scale and a longer time horizon. Essential herein is insight in the morphological evolution of different designs and nourishment frequency, which can be supported by the quantification of key indicators such as beach width, beach slope and profile volume (e.g. Momentary Coastline position) with a morphological model. Present morphological models that have been developed to evaluate sandy profile evolution on a decadal timescale can roughly be subdivided as (semi-)empirical (e.g. Bruun rule, ShoreTrans (McCaroll et al., 2020), CS-model (Larson et al., 2016)) or physics-based (e.g. XBeach, Unibest-TC, Delft-3D). (Semi-)empirical models have a relatively low computational effort which is a major advantage. Major limitations are the large dependence on parametrization choices and the absence of morphological detail as desired by different stakeholders. Process-based models provide more detail, but require a relatively large computational effort as well as extensive site-specific calibration. There is no scientific consensus yet which strategy is best for decadal forecasts and planning future strategies. This research aims to compare presently available tools that can simulate morphological indicators relevant to decisionmakers.
Methods
As a first step, long-term profile models are examined to simulate transects with varying nourishment history along the Dutch coast, and compared to surveyed profiles (figure 1.). Several model approaches are applied on multiple transects spanning nearshore, beach and dunes. To reflect a variety of nourishment scenarios, Dutch coastal transects that have different nourishment histories are selected, including a (relatively) undisturbed profile, a frequently nourished profile and a profile on a mega scale nourishment. The model performance is tested by simulating the evolution of these locations over 30 years, and comparing these simulations to surveyed profiles.
Results
This model analysis offers insight in the strengths and weaknesses of the various model approaches. Model results show that model performance varies with time horizon as well as the output parameter investigated. These results underpin that the transition between model types needs to be further explored, with the objective to select a modelling technique that best supports the engineer and decisionmaker on different nourishment strategies.
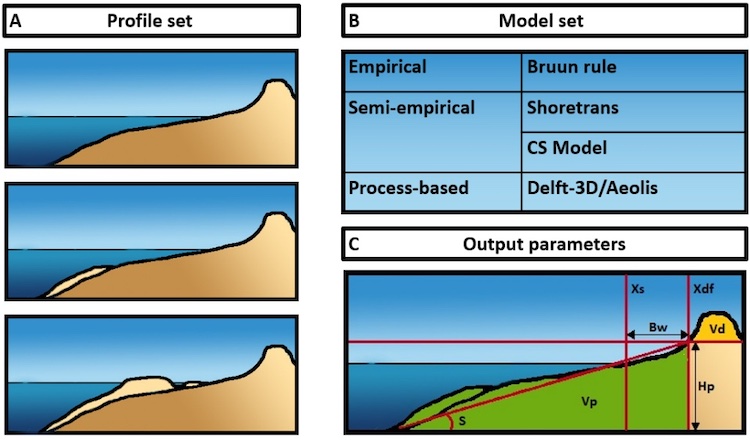
Figure 1. Overview of (A) cross-shore profile set, (B) model set and (C) investigated output parameters, including shoreline position Xs, dunefoot position Xdf, beach width Bw, dune volume Vd, profile slope S, profile volume Vp, profile height Hp.
I. Surname1*, F.N. Another-Surname2 , Y. Next-Surname2
1 University Name, Country; 2 Organization Name, Country
* Corresponding author: mail.name@organization.org
