P. Pourteimouri1*, G.H.P. Campmans1, K.M. Wijnberg1, S.J.M.H. Hulscher1
1 University of Twente, Water Engineering and Management, *
Introduction
The attractiveness of the coastal areas to people has led to the construction of buildings such as holiday cottages, restaurants, sailing clubs, recreational facilities and pavilions at the beach. These buildings change the local airflow patterns which, in turn, modify the sediment transport and erosion-deposition patterns around the buildings. On a longer time-scale, this can influence the functioning of the buildings and might need additional measures to smoothen the surface. In this research, we study how wind direction influences the flow regimes around a row of holiday cottages at the beach, to infer the erosion-deposition patterns.
Methodology
A numerical model is developed using OpenFOAM, which is an open-source computational fluid dynamics solver1. A three-dimensional computational domain with a row of ten buildings is modelled. The dimensions of the buildings are selected based on the real holiday cottages at the Kijkduin beach, the Netherlands (figure 1C). The distance between the buildings, ?, is considered the same as each building's width. The logarithmic wind velocity profile is applied from left to right and the wind angle, ?, is defined as the angle between the wind direction and the ? axis of the domain.
Results
The flow divergence patterns at ? = 0.25 ? show that for ? = 20° , the most significant depositions (figure 1B, blue shaded colors) are expected to occur in front of the upwind faces of the buildings. Further, small areas with sand accumulation are expected to develop just behind the leeward faces, which are extended as deposition tails. For ? = 40° , the wind facing sides increase and an additional deposition happens in front of the long side of the most upwind building. The deposition tails behind the buildings are formed parallel to the wind direction and they decrease in length with increasing wind angle. For ? = 80° , the deposition tails behind the buildings vanish and the most intensive erosion occurs very close to the long side of the first building (figure 1B, red shaded colors).
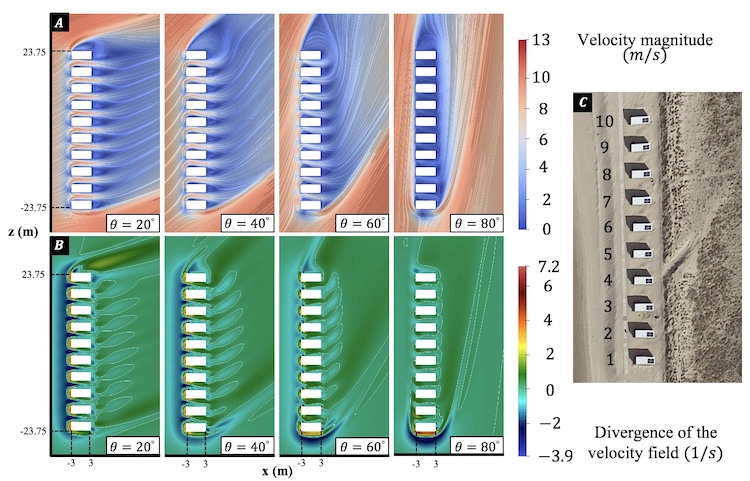
Figure 1: A) Horizontal velocity field around the buildings at y=0.25 m (white lines are streamlines), B) Erosion and deposition patterns close to the buildings inferred from velocity divergence at y=0.25 m (white lines are zero contours). C) A row of buildings at the Kijkduin beach, the Netherlands (source: google earth).
Acknowledgement
This PhD project is part of the ShoreScape project that is funded by NWO, RWS and HHNK.
I. Surname1*, F.N. Another-Surname2 , Y. Next-Surname2
1 University Name, Country; 2 Organization Name, Country
* Corresponding author: mail.name@organization.org
