R. van der Meijden1, J.H. Damveld1*, D.W. Ecclestone2, P.C. Roos1, J.J. van der Werf1
1 University of Twente
2 Ministerie van Defensie
*corresponding author:
Tidal sand waves are large-scale bed features that occur in sandy, shallow seas, such as the Netherlands Continental Shelf (NCS). Their significant dimensions and dynamic behaviour makes them relevant to many offshore activities. Despite the abundance of observational studies quantifying sand wave migration, large-scale, shelf-sea wide analyses are lacking. This research aims to gain insight in the spatial variability of sand wave migration on the NCS.
To facilitate this large-scale analysis, an appropriate migration detection method was developed in a GIS. Two methods were tested: Pairs of Source and Target Points (PSTP) and Spatial Cross Correlation (SCC). PSTP measures the distance and angle between vectorised crest and trough lines. SCC locates the two most correlated points in consecutive bathymetries and measures the distance and angle between them. PSTP was found most suitable for a large-scale analysis as its procedure is more transparent and the input parameters need less changing between different analyses.
Regarding migration direction, three distinct patterns were revealed (Figure 1 left). First, virtually all sand waves north of Rotterdam migrate towards the north/north-east. Second, bilateral reverse migration to the north-east or south-west occurs on the flanks of the Zeeland Banks and the Brown Ridge. Third, the sand waves in the south-western corner of the NCS migrate to the north-east and south-west. Average migration rates south of the Wadden Islands typically range between 0-3 m/year. Near the Wadden Islands, average migration rates typically range between 2-8 m/year. Distinct spatial patterns were revealed. First, migration rates are lowest in the south-west of the NCS and increase in north-eastern direction. Furthermore, migration rates are generally highest near the coast and on top of ridges and sandbanks (Figure 1 right).
This research has shown that PSTP, SCC, and GIS in general, are suitable for analysing sand wave migration. The obtained migration data can be used for studying the role of parameters and processes governing sand wave migration. The colour plots provide insight in the spatial variability of sand wave migration at an unprecedented coverage. These insights are valuable for offshore infrastructure planning, optimising hydrographic re-survey policies, dredging and mine hunting strategies.
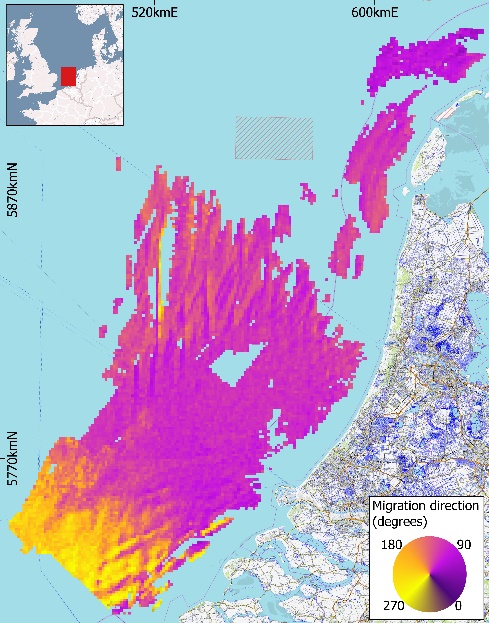
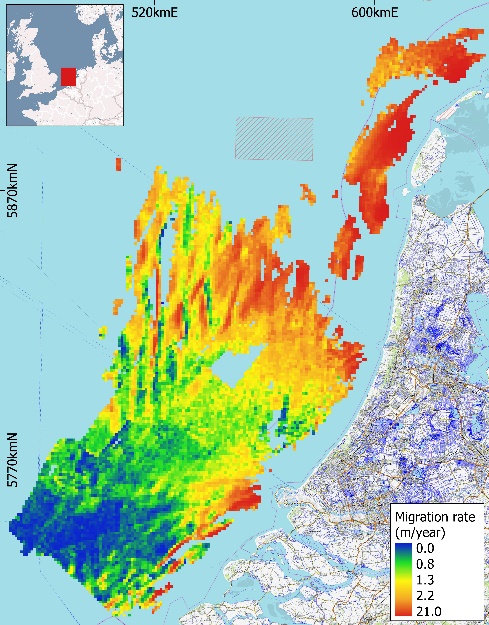
Figure 1: Left: Average migration direction (degrees) per square kilometre. Right: Average migration rate (m/year) per square kilometre.
I. Surname1*, F.N. Another-Surname2 , Y. Next-Surname2
1 University Name, Country; 2 Organization Name, Country
* Corresponding author: mail.name@organization.org
