T. de Wilde1*, F.E. Roelvink1, M. van der Wegen1,2, S.G. Pearson3
1 Deltares, Department of Applied Morphodynamics; 2 UNESCO-IHE, Institute for Water Education; 3 Delft University of Technology, Faculty of Civil Engineering and Geosciences
*corresponding author:
Introduction
San Francisco Bay (SF Bay) is one of the largest estuaries along the U.S. West Coast, connected to the Pacific Ocean through the Golden Gate. The estuary has been subject to anthropogenic activities, such as channel dredging and sand mining. Replenishment potential of these mining locations and their impact on the neighbouring bathymetry is mostly not known. This research assesses how sediment dynamics connect the mining areas to their surrounding environment. This shows, on a regional scale, which areas may morphologically be affected by the respective mining activities. The SedTRAILS methodology and its visualisation of sediment dynamics shows to be a promising tool to analyse the impact of dredging activities.
Methods
The sediment transport will be calculated using a morphostatic depth averaged Delft3D 4 model, set-up and validated by Elias and Hansen (2013). As postprocessing step, SedTRAILS (Sediment TRAnsport vIsualization & Lagrangian Simulator) was applied to visualize and analyse both the net and gross sediment pathways to determine the connectivity within SF Bay (Pearson et al., 2021).
Results
In an environment like SF Bay, influenced by tidal forcing, waves, river discharge and complex geometry, the SedTRAILS results give a clear indication of sediment transport directions. SedTRAILS results show that the influence of waves and river discharge on the sediment transport is limited when compared with the tidal forcing. SedTRAILS results clearly reveal sub-area connections and local relocation of sediment. Figure 1 illustrates, as an example, that on the short-term sediment is mainly coming from the North and deposited at the shoal south of Angel Island. On the longer term, sediment is also coming from South Bay and mainly ending up beyond the Golden Gate, at the ebb tidal delta.
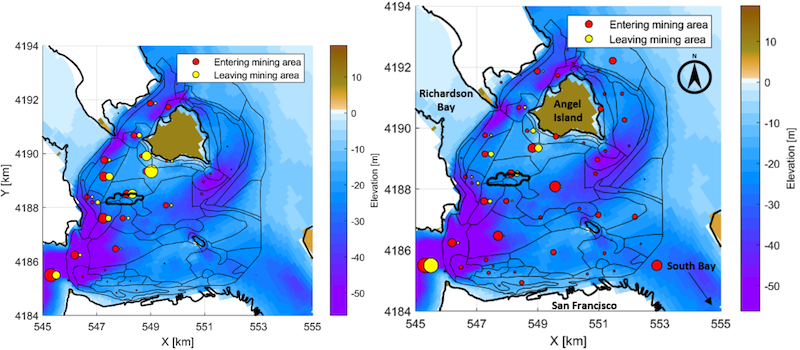
Figure 1: Connectivity of mining ring (black contour below Angel Island) with surrounding areas for (a) 5 tidal cycles and (b) 50 tidal cycles, the size of the dot indicates the strength of the connectivity.
References
Elias, E. P., & Hansen, J. E. (2013). Understanding processes controlling sediment transports at the mouth of a highly energetic inlet system (San Francisco Bay, CA). Marine Geology, 345, 207-220.
Pearson, S. G., Elias, E. P. L., van Ormondt, M., Roelvink, F. E., Lambregts, P. M., Wang, Z., & van Prooijen, B. (2021). Lagrangian sediment transport modelling as a tool for investigating coastal connectivity. In Coastal Dynamics Conference 2021.
I. Surname1*, F.N. Another-Surname2 , Y. Next-Surname2
1 University Name, Country; 2 Organization Name, Country
* Corresponding author: mail.name@organization.org
