Jim Regtien1*, Saeb Faraji Gargari1, Michiel van den Broeke1 and Gerben Ruessink1
1Utrecht University
* Corresponding author: j.regtien@students.uu.nl
Introduction
For decades, coastal managers have attempted to stabilize the foredunes as much as possible, turning them into uniform, densely vegetated ridges. While this strategy has been successful at encouraging growth of the foredune, it has also stopped sand input from the beach to the backdunes. This could potentially worsen future flood risk, as the dunes are now prevented from growing with sea level rise. Furthermore, this lack of sand input, amongst other factors, has negatively affected the biodiversity in the backdunes.
Foredune blowouts have been proposed as a solution to these problems, as they can facilitate landward sand transport for deposition onto the backdunes. Field experiments where notches, which can be seen as the anthropogenic equivalent of blowouts, have been dug into the foredune have shown positive effects on the total landward sediment budget. The local wind field is the controlling factor for how efficiently sand is transported to the backdunes, and, as this is mostly determined by secondary flow (i.e. interactions with topography), the question remains: what is the optimal notch geometry for encouraging long-term sand input to the backdunes?
Objective and Methods
We aim to investigate how the geometry of a foredune notch controls the local wind field. In order to do this, we first examine existing wind measurements in a notch in Dutch National Park Zuid-Kennemerland. This site and data also serve as a test case for our computational fluid dynamics (CFD) model. In the future, we plan to find the ‘optimal’ notch geometry by running simulations with ‘synthetic’ notches, in which we systematically vary notch geometry (e.g., width at seaward side, perimeter, slope of the notch floor).
We model the airflow in a foredune notch at the Zuid-Kennemerland area, the Netherlands using CFD. The dimensions of this blowout are 110 m (along-shore) x 250 m (cross-shore) x 10 m (height) [1]. Inside this blowout, four sonic anemometers were placed in 2017 and 2018 at the seaward notch entrance (SA 1), inside the through of the blowout (SA 2 & 3) and on the depositional lobe (deposit of sediment located at the terminus of a blowout, SA 4).
The wind field is modeled using the opensource CFD software package openFOAM [2]. The model is evaluated against measurements obtained with the sonic anemometers in order to show that it can accurately reproduce the wind field.
Results
Blowouts have a significant topographic forcing effect on the wind field (i.e. modulate the flow velocity). In figure 1A, the wind speed as measured by the SAs is shown. If wind blows into the blowouts entrance (incident wind from -50 to 50 degrees), a gradual acceleration is observed from SA 1 to 3. At the depositional lobe, a deceleration compared to the previous SA is observed. This is caused by the lateral walls acting as a ‘funnel’ for the wind.
Inside the blowout, the wind is gradually redirected into a direction that is parallel to the blowouts long axis. Figure 1b illustrates this: at SA 1, the wind blows still in a similar direction to the incident wind. At SA2, the wind is already steered somewhat to be more oriented along the blowout axis. At SA 3, the wind only deviates very slightly from the blowout axis, no matter what direction the wind comes from.
On figure 1A and B, the model output is also shown. The model agrees with the measurements to a high degree, leading us to conclude that it reproduces the wind field and is suitable to investigate the impact of notch geometry on wind flow.
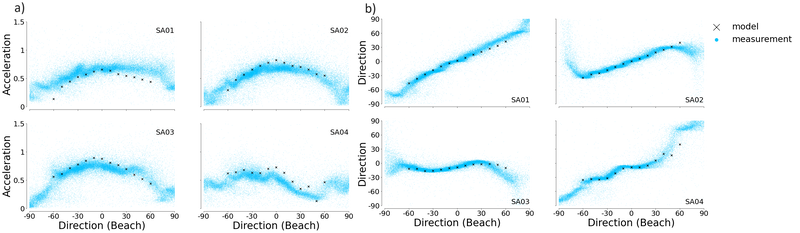
Figure 1: a) shows the wind velocity at every sonic anemometer (blue dots) for incident wind directions from -90 to 90 degrees and model output (black crosses) for incident wind directions from -60 to 60 degrees. b) shows the measured wind direction at the SAs. The directions are all relative to the blowout axis. The wind speed is normalized to the 10m wind measured at the weather station in IJmuiden. This station is located only 2km away from our study site and thus, the measurements by this station were seen as representative of the wind at the beach.
References
[1] B.G. Ruessink, S.M. Arens, M. Kuipers, J.J.A. Donker, Coastal dune dynamics in response to excavated foredune notches, Aeolian Research, Volume 31, Part A, 2018, Pages 3-17, ISSN 1875-9637, https://doi.org/10.1016/j.aeolia.2017.07.002.
[2] Thomas A.G. Smyth, A review of Computational Fluid Dynamics (CFD) airflow modelling over aeolian landforms, Aeolian Research, Volume 22, 2016, Pages 153-164, ISSN 1875-9637, https://doi.org/10.1016/j.aeolia.2016.07.003.
