
E.B. Sipma1*, J.J. Warmink1, T.M. Duong1,2 and S.J.M.H. Hulscher1
1 University of Twente, The Netherlands; 2 IHE Delft, The Netherlands
*corresponding author: e.b.sipma@utwente.nl
Introduction
Climate change effects such as sea level rise and increased frequency and intensity of storms raise the need for reliable measures to provide continued safety from flooding at the coast. Space is limited for heightening or construction of conventional engineered dikes as they border populated areas, agricultural land or nature reserves. Furthermore, these kind of structures can act as a physical barrier that can lead to coastal squeeze and can act as an ecological barrier. Coastal wetland ecosystems, such as salt marshes, can serve as alternative, nature-based solution or foreshore in a Living Dike, that combines several beneficial ecosystem services with coastal flood protection. Salt marshes are tidally inundated ecosystems that are covered by salt-tolerant vegetation that can attenuate waves due to their shallower elevation and presence of vegetation. Furthermore, they have the ability to heighten with sea level rise by capturing sediment and can limit the occurrence of e.g. piping erosion and severity of flooding in a dike breach when fronting a dike (Zhu et al., 2020). However, as the dynamic nature of a salt marsh creates natural variation in space and development over time, it needs to be understood how to incorporate this into a reliable flood protection measure.
Objective and Methods
The aim of this study is to gain insight into the spatial variations that can occur for salt marshes and quantify the magnitudes of the variations that do occur. The focus here is on variations in bathymetry, with the plan to include variations in vegetation cover at a later point. For the bathymetry, elevation profiles of salt marshes along the mainland coast of the Dutch Wadden Sea and Ems-Dollard estuary (Harlingen-Nieuwe Statenzijl, about 170 km) are studied. These elevation profiles are taken from the bathymetric dataset referred to as ‘Vaklodingen’, which is collected by Rijkswaterstaat (part of the Dutch Ministry of Infrastructure and Environment) and has a spatial resolution of 20 m. The most recent measurement ‘sweep’ of 2015-2020 is used here. The elevation cross-sections are taken at a regular distance interval along the primary water defence (Nationale Basisbestanden Primaire Waterkeringen, Rijkswaterstaat), in either a fixed orientation or perpendicular to the dike transect. Every cross-section is categorized into salt marsh, tidal flat or neither, by using an ecotope map of the Dutch Wadden Sea (2017, Rijkswaterstaat). By analysing the cross-sections containing a salt marsh in front of the dike, a quantification of salt marsh bathymetry variation along the Wadden Sea coast is made.
Results
For the preliminary results, cross-sections with a spacing of 500 m along the dike transect are considered, with a fixed orientation of 320°. This orientation roughly corresponds to the northwest direction of incoming waves that one would expect to give the highest risk of flooding during an extreme storm. As an example, Figure 1 shows a part of the coastline considered, with elevation profiles of cross-sections for three distinct salt marsh sites displayed in subfigures. The part of the elevation profile categorised as salt marsh is coloured, with the colour matching where the cross-section occurs on the map. Only sites with a marsh width of at least 80 m are studied further, which is roughly 40% of the coastline considered. Preliminary quantification of the dimensions is done by making a linear least-squares fit through all salt marsh profiles. This yields an average elevation in between about 1.5 to 2 m above NAP, with a deviation from the linear profile of up to about 1.5 m. The average slope was found to often be very gentle, with a maximum of up to about 1:400. Furthermore, in many cross-sections there is a presence of human structures (e.g. summer dikes), which affects the salt marsh dimensions.
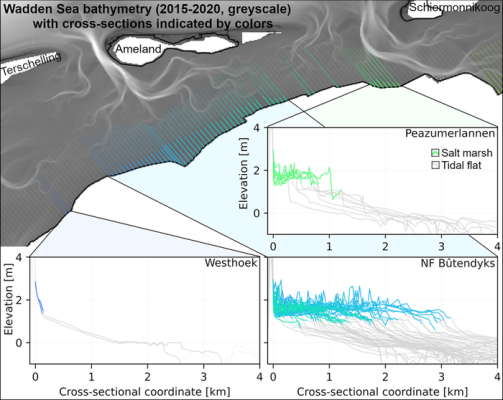
Figure 1 – (top) Bathymetry map of a section of the Friesian Wadden Sea coast, with cross-sections drawn every 500 m along the primary dike (orientation: 320°). Cross-sections containing a salt marsh are coloured, with the line becoming more transparent for the tidal flat and tidal channel. (subfigures) Elevation profiles along the cross-sections as indicated in the top figure for three salt marsh sites. Colours indicate the part of the profile categorised as salt marsh and correspond to the locations in the top figure, grey indicates tidal flat and tidal channel.
References
Zhu, Z., Vuik, V., Visser, P. J., Soens, T., van Wesenbeeck, B., van de Koppel, J., Jonkman, S. N., Temmerman, S., & Bouma, T. J. (2020). Historic storms and the hidden value of coastal wetlands for nature-based flood defence. Nature Sustainability, 3(10), 853–862. https://doi.org/10.1038/s41893-020-0556-z
