Z. T. F. Tam1,2*, P. H. P. Overes2,3 , A. P. Luijendijk1,2, A. J. H. M. Reniers1
1 Delft University of Technology; 2 Deltares; 3 University of Twente
* Corresponding author: zeta.tam@deltares.nl
Introduction
Sand waves are one of the large-scale seabed morphological features, with a typical wave height of metres and a wavelength of hundreds of metres. Their mobile nature causes a risk to offshore infrastructure and marine transport. Pre-sweeping is a construction procedure commonly involved in submarine utilities installation to dredge existing sand waves and thereby reduce their impact to the utilities. Nevertheless, recovery of sand waves is usually observed after dredging and the underlying processes of sand wave recovery remain relatively underexplored. Current models predicting sand wave recovery are limited to empirical relations or 2DV model applications. Considering the accelerating offshore infrastructure development at present, more understanding on the interaction between offshore morphology and human intervention, together with the development of an effective prediction tool, will markedly optimise dredging planning.
Objective and Methods
This study aims to investigate the drivers of sand wave recovery and examine the modelling performance of Delft3D Flexible Mesh (FM) on the recovery process through a case study. A location in the Southern North Sea was studied and a 3D FM model was applied to replicate the sand wave recovery observed in the case study. This model is the first 3D morphological model specifically for simulating sand wave recovery after pre-sweeping with a high resolution of 2m.
Results
The results show that the transverse slope effect and the oblique current flow supply sediment into the dredged area causing fill-in and sand wave recovery. This study also elaborates on the two stages in the recovery: an adaption period referring to the morphological adaption of the dredged profile in response to the forcing and a subsequent regeneration period referring to the growth of a feature developed during the adaption period. With the incorporation of supercomputer and MORFAC, this three-year recovery process was able to be simulated in a high-resolution 3D model within one day in wall-clock time.
Although the precise estimation of the computed recovery duration remains challenging, this pioneering research provides an explanation on how tidal flow drives the recovery. In addition, it demonstrates the unique capabilities of Delft3D FM in modelling this complex phenomenon efficiently.
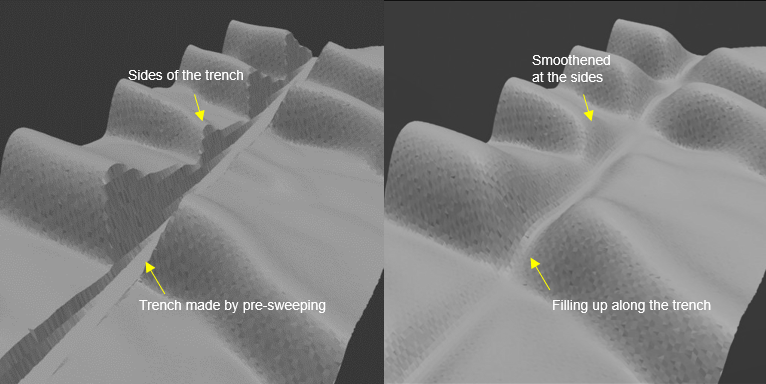
Figure 1: Sand waves in the study area in Delft3D FM model before (left) and after (right) the simulation (vertical scale is exaggerated for better illustration.)
