
J.S. Löhr1*, B.G. Ruessink1 , T.D. Price1
1 Utrecht University, The Netherlands
* Corresponding author: j.s.lohr@students.uu.nl
Introduction
Climate change is expected to worsen erosion of many sandy coastlines globally in the future. Nowadays, a total amount of approximately 12 million m3 of sand is annually nourished to maintain the Dutch coastline, mainly consisting of beach and shoreface nourishments. However, knowledge is still limited of the effects of beach and shoreface nourishments on the dynamics of the shoreline and its (long-term) temporal and spatial trends, especially in the case of repeated sand nourishments. The latter is of particular relevance, because nourishment efforts are likely to increase in the future due to sea level rise. The overarching objective of this study was to quantify and hence better understand shoreline dynamics of high-energy, low-sloping beaches that are repeatedly nourished.
Objective and Methods
The Python toolkit CoastSat (Vos et al., 2019) has been used to extract time-series of cross-shore shoreline position from satellite imagery (Landsat 5, 7, 8, 9 and Sentinel-2) for the period between 1985 and 2023 for a 13.5 km stretch of coast located in front of the Dutch beach towns of Castricum, Egmond and Bergen. The northern part at Egmond and Bergen has been repeatedly nourished while the southern part remained unnourished during the studied period. The instantaneous shorelines were adjusted to a standard reference level to account for the influence of tides, wave runup and storm surge. Subsequently, the temporal variability in the shoreline could be studied (storms, seasons, long-term trends), as well as the spatial shoreline changes in response to the repeated nourishments.
Results
The results, illustrated as a space-time diagram in Figure 1, show that the repeated sand nourishments led to a gradual seaward expansion of the shoreline over time with an increasing interannual trend of 2.00 m/yr in the nourished section (to the right of alongshore beach pole 4000), while the unnourished section (to the left of alongshore beach pole 4000) remained more or less stable (+0.31 m/yr). The shoreline further presents itself to be very robust with only small seasonal cycles (amplitude of c. 10 m) and a minor (if any) response to storm events. The beach nourishments constructed between 1990 and 2000 only resulted in relatively small (< 10 m) and temporary (< 1 - 2 years) localised progradation of the shoreline. In contrast, the repeated shoreface nourishments at the nourished section (often in combination with a beach nourishment), in the longterm, led to a much more prominent seaward advance (~50 m) of the shoreline. The nearby non-nourished beaches, on the other hand, did not exhibit this seaward advance of the shoreline, suggesting limited alongshore dispersal of the nourished sand to the adjacent shorelines.
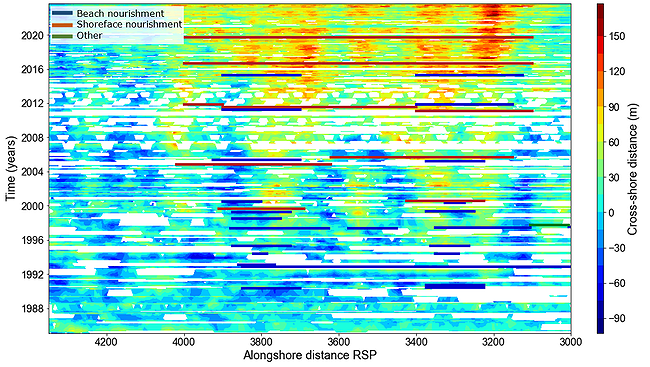
Figure 1: Spatiotemporal evolution of the shoreline with the timing and alongshore extent of the beach and shoreface nourishments. The alongshore distance is expressed as beach pole distance (RSP) with, for instance, one kilometre between beach poles 3000 and 3100. Blue colours represent a more landward situated shoreline, while orange and red colours represent a more seaward situated shoreline. North is to the right and south is to the left. The blank spaces between the data represent missing values.
References
Vos, K., Splinter, K. D., Harley, M. D., Simmons, J. A., & Turner, I. L. (2019). CoastSat: A Google Earth Engine-enabled Python toolkit to extract shorelines from publicly available satellite imagery. Environmental Modelling & Software, 122, 104528. https://doi.org/10.1016/j.envsoft.2019.104528
