D.C. Hulskemper1*, K. Anders2, J.A.Á. Antolínez1 , R.C. Lindenbergh1
1 Delft University of Technology, The Netherlands; 2 Technical University of Munich, Germany
* Corresponding author: d.c.hulskemper@tudelft.nl
Introduction
Sandy beach-dune systems are among the most dynamic and complex coastal environments. Enhanced climate change will change the state of these systems, leading to probable disappearance of half of the world's sandy beaches (Vousdouskas et al., 2020). These systems are also directly influenced by human factors, such as the building of coastal structures, and modification of sediment flux (Mentaschi et al., 2018). These factors imply that extensive knowledge of how these systems behave, how we influence them, and how we could sustain them is essential but complex to obtain.
The impact of human drivers on sandy beach surface dynamics, particularly their contribution to dune development, has not yet been fully grasped and integrated into models. Moreover, the interaction between various natural drivers and patterns of surface dynamics over short time scales (days to months), remains not fully understood. A better comprehension of the drivers behind sediment transport between dunes and the sea is needed for more effective nourishment and reducing coastal squeeze (De Schipper et al., 2021).
Objective and Methods
This research, as part of the AdaptCoast project, aims to develop methods to detect, characterize, (inter)correlate, and predict types of human and naturally induced surface dynamics on a sandy beach. As first part of the research, datasets consisting of years of hourly point clouds of a beach are analyzed, acquired in permanent laser scanning setups in the Netherlands (Kijkduin and Noordwijk).
Short-term surface dynamics are automatically extracted as 4D objects-by-change (4D-OBCs, Anders et al., 2021). These thousands of surface activities are grouped and characterized (e.g., intertidal bar depositions, bulldozer work) using unsupervised clustering methods, namely a Self-organizing Map with subsequent hierarchical clustering. Then, various natural and human drivers (e.g., meteorological data) are compared to find possible correlation and causation.
Results
The workflow is already tested on the Kijkduin dataset, consisting of 6 months of hourly point clouds. Here it is shown that physically interpretable clusters of surface activity can be automatically extracted. For example, bulldozer work and intertidal bar deposition events are clearly grouped separately. When comparing the occurrences of these groups of surface activity to knowledge of natural and human drivers, correlations can be found. Clusters of bulldozer surface activities mostly occur in periods when the preparation for the summer season starts, whereas the destruction of intertidal bar surface activities coincides with storm conditions.
These results show that the workflow could enable long-term automated monitoring of surface activity in the complex sandy beach-dune systems. When applied on the more extensive dataset of Noordwijk (three years), more decisive correlations are expected to be found, as well as (intra)annual variability and their relation to larger scale development. This knowledge will be used to develop models for predicting surface dynamics, which should enable better measurement and management strategies on human influenced sandy beaches.
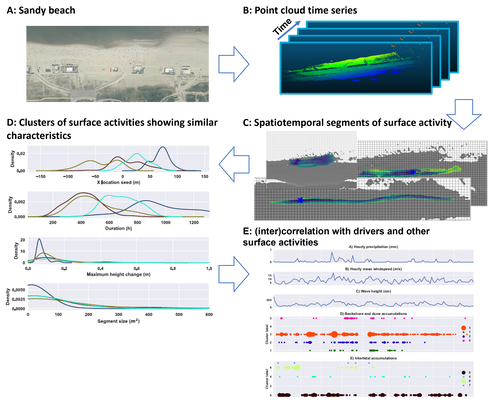
Graphical abstract of the research. From a point cloud time series (B) of a sandy beach, acquired using permanent laser scanning, spatiotemporal segments of surface activity (C) are extracted. These are grouped together using unsupervised clustering methods. From these clusters the characteristics of different types of surface activity (D, e.g., size, maximum height change, duration) can be obtained. After which the occurrence of types of surface activities over time can be analysed and compared to natural drivers and other types of surface activities (E). In E, every dot represents the initiation of surface activities. The colour represents the cluster to which the surface activities are assigned, and the size the number of initiations of this cluster at that point in time.
References
Anders, K., Winiwarter, L., Mara, H., Lindenbergh, R., Vos, S. E., & Höfle, B. (2021). Fully automatic spatiotemporal segmentation of 3D LiDAR time series for the extraction of natural surface changes. ISPRS Journal of Photogrammetry and Remote Sensing, 173, 297–308. https://doi.org/10.1016/J.ISPRSJPRS.2021.01.015
Mentaschi, L., Vousdoukas, M. I., Pekel, J. F., Voukouvalas, E., & Feyen, L. (2018). Global long-term observations of coastal erosion and accretion. Scientific Reports, 8(1). https://doi.org/10.1038/s41598-018-30904-w
de Schipper, M. A., Ludka, B. C., Raubenheimer, B., Luijendijk, A. P., & Schlacher, T. A. (2021). Beach nourishment has complex implications for the future of sandy shores. In Nature Reviews Earth and Environment (Vol. 2, Issue 1, pp. 70–84). Springer Nature. https://doi.org/10.1038/s43017-020-00109-9
Vousdoukas, M. I., Ranasinghe, R., Mentaschi, L., Plomaritis, T. A., Athanasiou, P., Luijendijk, A., & Feyen, L. (2020). Sandy coastlines under threat of erosion. In Nature Climate Change (Vol. 10, Issue 3). https://doi.org/10.1038/s41558-020-0697-0
