P. Pourteimouri1*, G.H.P Campmans1, K.M. Wijnberg1 , S.J.M.H Hulscher1
1 University of Twente, Water Engineering and Management
*
Introduction
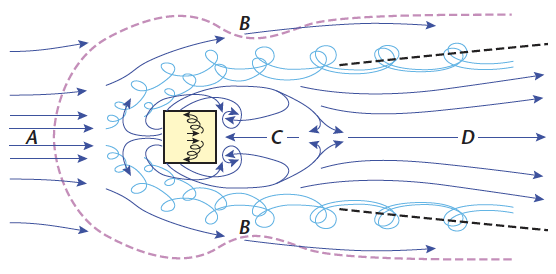
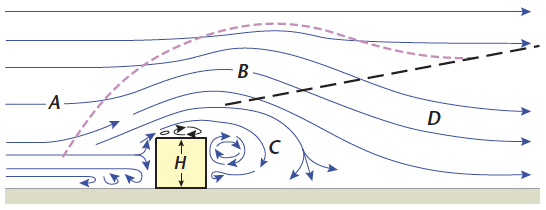
Coastal zones have always attracted a large number of people because of the resources and the recreations that they provide. This highly increasing population living along the coastline, increases the demands for construction of restaurants, beach houses and pavilions at the beach-dune interface. These structures block the wind flow and change the airflow patterns which in turn alter the sediment transport pathways and influence the aeolian sand dunes. Figure 1 schematically shows the mean flow field around a cubic building which contains recirculation zones on the top, front and sides of the structure and in the downstream cavity region.
a) Side view
b) Plan view
Figure 1 Airflow around an isolated cubic building a) side view, and b) plan view near ground level. A, B, C and D show the incident wind direction, displacement zone, cavity and the wake, respectively. [Oke et al., 2017]
The significant impacts that the buildings' characteristics and their positioning at beaches can have on wind flow patterns and - consequently on aeolian sediment transport - are not fully understood. In this study, we focus on an isolated cubic building and the investigation of the airflow patterns around it.
Modelling flow around buildings
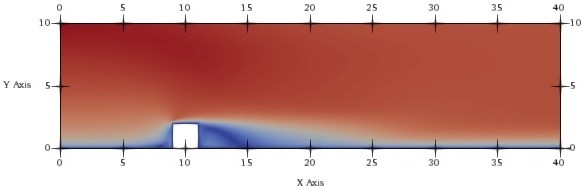
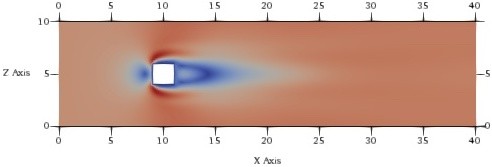
An open-source CFD solver, OpenFOAM, was used to solve the Reynolds-averaged Navier-Stokes equations (RANS). The commonly used k - ε turbulence closure model was used to simulate turbulent flow structures that are formed around the building. The logarithmic profile was implemented for the inlet wind velocity and the no-slip boundary condition was used for the bottom of the computational domain and the walls of the building. The reference velocity of 6 m/s at the reference height of 10 m was used. The surface roughness height was considered uniform and equal to 0.03 m. Figure 2 shows the three-dimensional model predictions for the wind velocity distribution around an isolated cubic building which is 2 meters in high, length and width.
a) Side view
b) Plan view
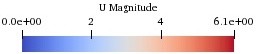
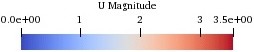
Figure 2 OpenFOAM model predictions of wind velocity (m/s) around an isolated cubic building.
a) side view (half plane) b) plan view (at the elevation of 0.3 meter from surface)
References
Oke, T. R., Mills, G., Christen, A., & Voogt, J. A. (2017). Urban climates. Cambridge University Press.
I. Surname1*, F.N. Another-Surname2 , Y. Next-Surname2
1 University Name, Country; 2 Organization Name, Country
* Corresponding author: mail.name@organization.org
